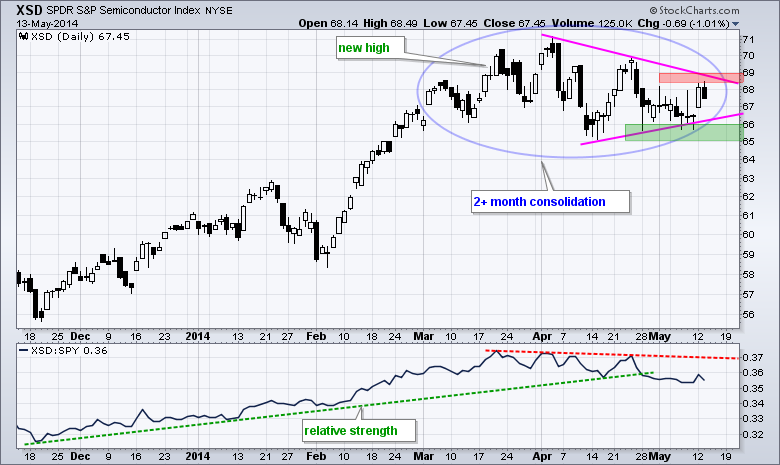
Stocks were mixed on Tuesday with the Russell 2000 ETF (IWM) falling around 1% and the S&P 500 SPDR (SPY) advancing .1% on the day. Eight of the nine sector SPDRs were up, and just one down. The gains were small with the Energy SPDR (XLE) leading the way (+.38%). The equal-weight sectors were more mixed with five up and four down. The Equal-Weight Consumer Discretionary ETF (RCD) and Equal-weight Finance ETF (RYF) led the way with losses of .35% and .39%, respectively. These losses were relatively modest and selling pressure was not that intense. Those looking for clues on the technology sector can turn to the Semiconductor SPDR (XSD) for guidance. XSD hit a new high in March and consolidated the last two months. The range has narrowed as a triangle takes shape. Watch 69 up and 65 down for the next directional break.
**This chart analysis is for educational purposes only, and should not
be construed as a recommendation to buy, sell or sell-short said securities**
**************************************************************
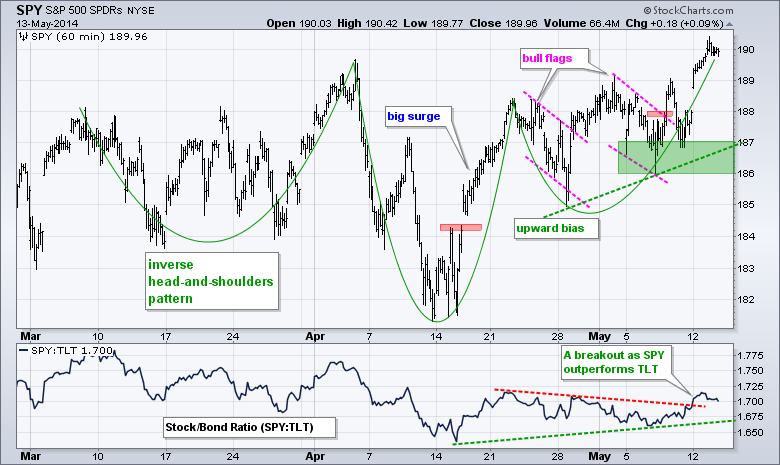
No change. SPY gapped up and surged to a new high this week. First, the gap is bullish. Second, prices continued higher after the gap. After the big April surge, SPY is simply zigzagging higher and the trend here is clearly up. The May lows combine to mark key support in the 186-187 area. The indicator window shows the SPY:TLT ratio breaking out as stocks start outperforming bonds.
**************************************************************
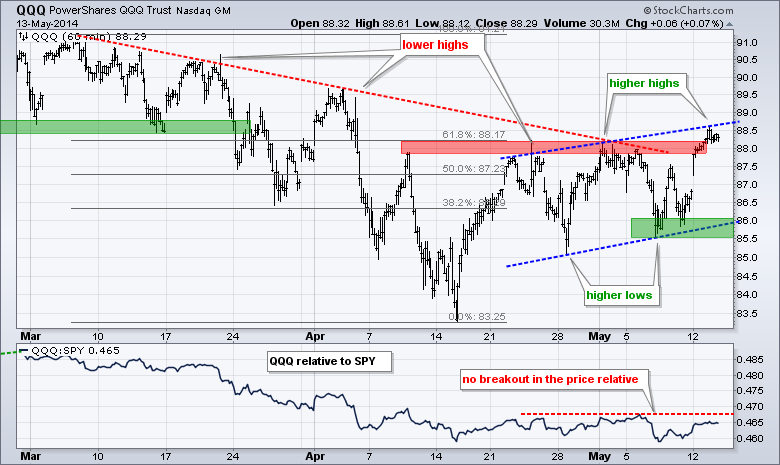
No change. QQQ found support in the 86 area and surged to resistance with a gap. There is a choppy uptrend working the last few weeks with higher lows and higher highs. The break above resistance at 88 affirms this uptrend with a higher high. The early May lows mark key support in the 85.5-86 area.
**************************************************************
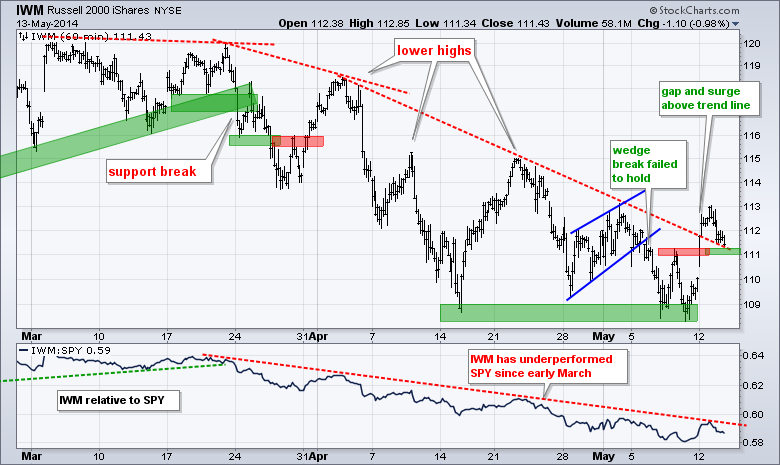
No change. IWM found support in the 109 area and surged above 112 with a gap. Not only did the ETF gap up, but it also continued higher after the gap and broke the early April trend line. I will treat this gap-surge as a bullish breakout as long as it holds. A move back below 110.9 would suggest a failure and call for a reassessment.
**************************************************************
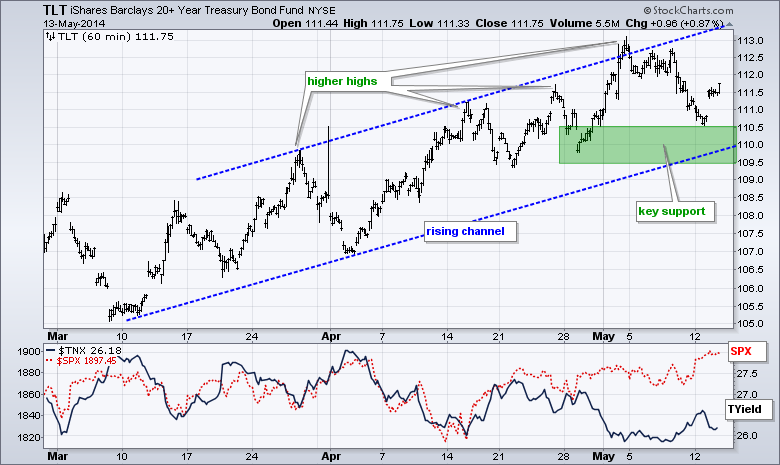
The 20+ YR T-Bond ETF (TLT) fell to 110.5 with a rather sharp decline and then rebounded after a weak retail sales report. This bounce keeps the series of higher lows in place and allows me to raise key support. The trend remains up since mid March with support marked in the 109.5-110.5 area.
**************************************************************
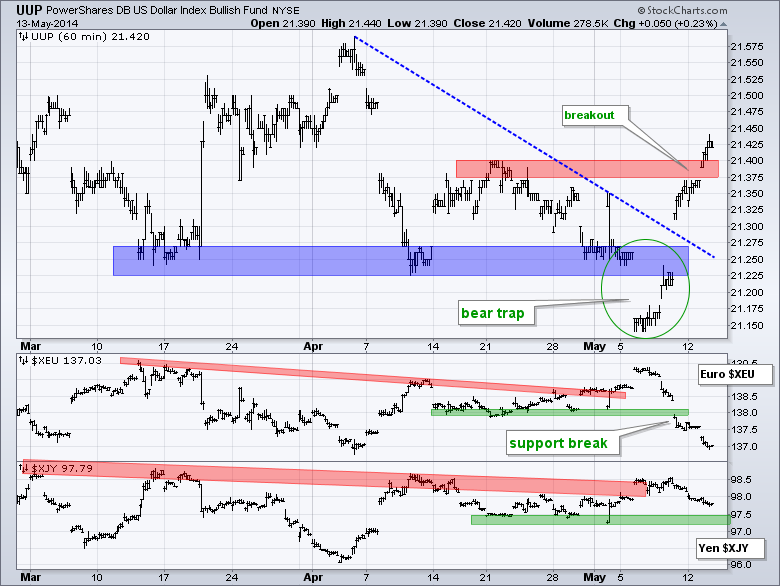
The US Dollar ETF (UUP) continued higher and broke above the late April highs. The bear trap provided the first sign of a trend reversal and this follow through breakout signals the start of an uptrend. Dollar strength is built on Euro weakness as the Euro Index ($XEU) broke support with a sharp decline over the last few days.
**************************************************************
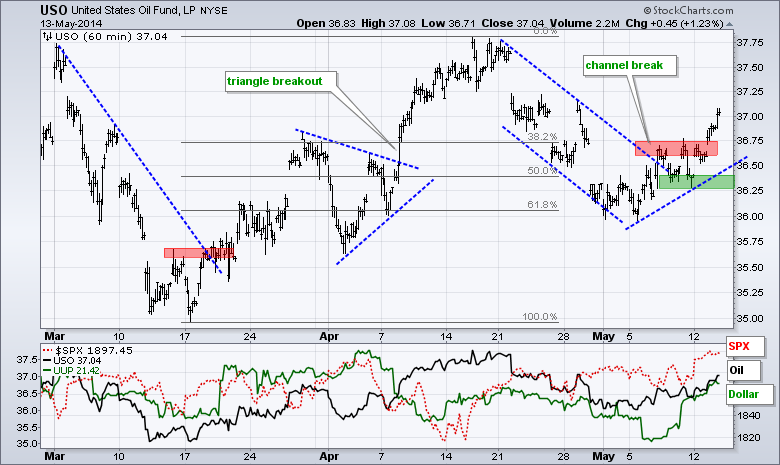
The USO Oil Fund (USO) broke out with a surge above 36.75 on Tuesday. Overall, the ETF retraced 62% of the prior decline with a falling channel and found support in the 36 area in early May. The trend line break was the first positive and today's break argues for a continuation of the March-April advance. Key support is set at 36.25.
**************************************************************
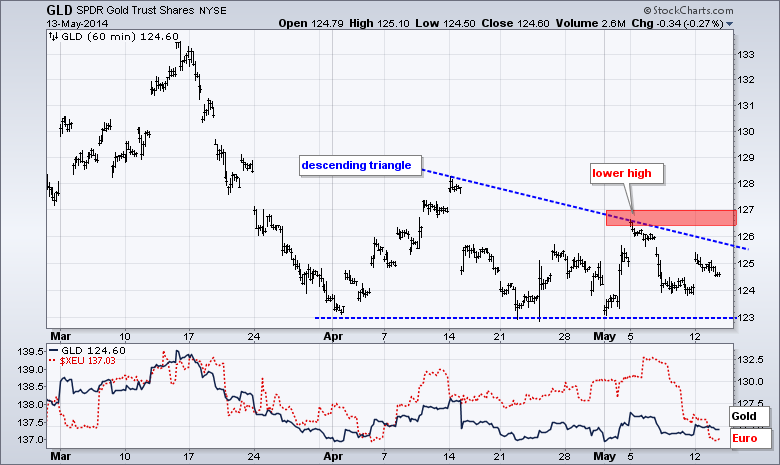
Gold could not breakout with tensions in Ukraine and must now contend with a strengthening Dollar. The Gold SPDR (GLD) remains with a descending triangle, which is a bearish continuation pattern. The lower high in early May indicates that buying pressure was not strong enough to trigger a breakout or upside follow through to the bounce. The relatively equal lows represent the demand line. A break here would signal a victory for supply and target a move to the 118 area.
***************************************************************
Key Reports and Events (all times Eastern):
Wed - May 14 - 07:00 - MBA Mortgage Index
Wed - May 14 - 08:30 - Producer Price Index (PPI)
Wed - May 14 - 10:30 - Crude Oil Inventories
Thu - May 15 - 08:30 - Initial Jobless Claims
Thu - May 15 - 08:30 - Consumer Price Index (CPI)
Thu - May 15 - 08:30 - Empire State Manufacturing
Thu - May 15 - 09:15 - Industrial Production
Thu - May 15 - 10:00 - Philadelphia Fed Index
Thu - May 15 - 10:00 - NAHB Housing Market Index
Thu - May 15 - 10:30 - Natural Gas Inventories
Fri - May 16 - 08:30 - Housing Starts/Building Permits
Fri - May 16 - 09:55 - Michigan Sentiment
This commentary and charts-of-interest are designed to stimulate thinking. This analysis is not a recommendation to buy, sell, hold or sell short any security (stock ETF or otherwise). We all need to think for ourselves when it comes to trading our own accounts. First, it is the only way to really learn. Second, we are the only ones responsible for our decisions. Think of these charts as food for further analysis. Before making a trade, it is important to have a plan. Plan the trade and trade the plan. Among other things, this includes setting a trigger level, a target area and a stop-loss level. It is also important to plan for three possible price movements: advance, decline or sideways. Have a plan for all three scenarios BEFORE making the trade. Consider possible holding times. And finally, look at overall market conditions and sector/industry performance.


