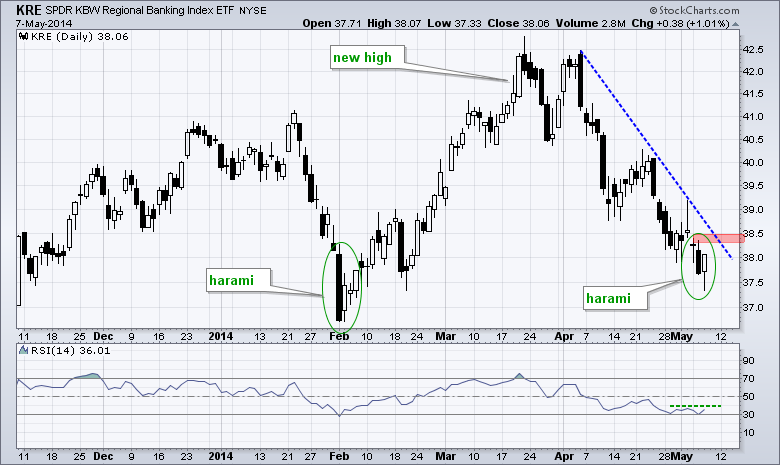
Stocks opened weak, firmed and rallied into the close. The major index ETFs finished with modest gains, but the Nasdaq 100 ETF closed slightly lower. The Finance SPDR and Utilities SPDR led the sectors higher. The Consumer Discretionary SPDR fell as the Retail SPDR declined around 1%. Weakness in retail and consumer discretionary is a concern. The Technology SPDR was down a fraction as the Internet ETF fell another 2%. The chart below shows the Regional Bank SPDR (KRE) forming a harami just above the early February low, which is also marked by a harami. RSI touched 30 on Tuesday to become oversold. Even though the two month trend is down, I think the six month trend is up and KRE is at an interesting juncture right now. A break above 38.5 would provide the first signs of a reversal.
**This chart analysis is for educational purposes only, and should not
be construed as a recommendation to buy, sell or sell-short said securities**
**************************************************************
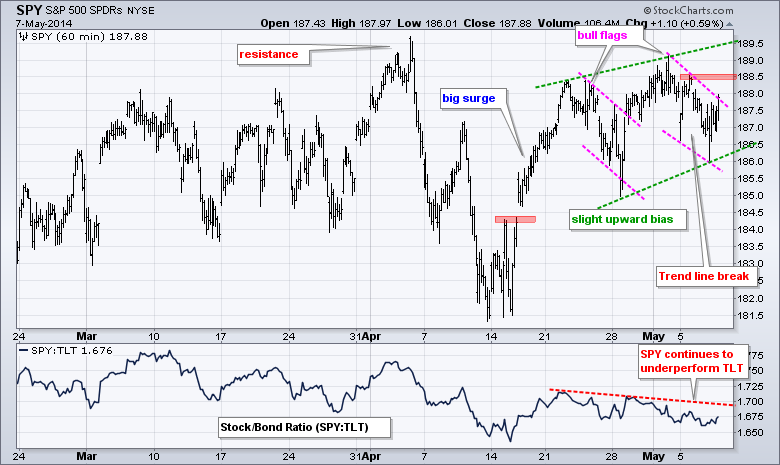
SPY plunged below support at 186.5 in early trading, but immediately recovered and closed near 188. The chart remains with an upward bias as a bull flag takes shape. SPY surged from 181.5 to 188 in mid April and then embarked on a choppy range with two falling flags. This range has a slight upward bias because of the higher highs and higher lows. With Wednesday's surge, the ETF broke the flag trend line and follow through above 188.5 could lead to new highs. The SPY:TLT ratio continues to edge lower and a break above 1.7 would be bullish for stocks. This would signal that stocks are outperforming Treasuries.
**************************************************************
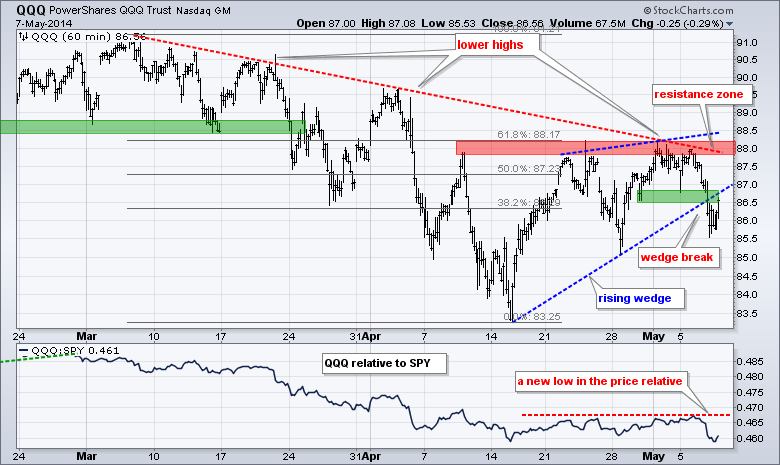
QQQ broke wedge support with a sharp decline and broken support in the 86.5-87 area turns first resistance. A quick move above 87 would be the first sign that this break is going to fail. I will leave key resistance in the 88 area for now. The indicator window shows the price relative (QQQ:SPY ratio) hitting a new low as QQQ continues to underperform the broader market. High growth and high valuation are not the places to be right now.
**************************************************************
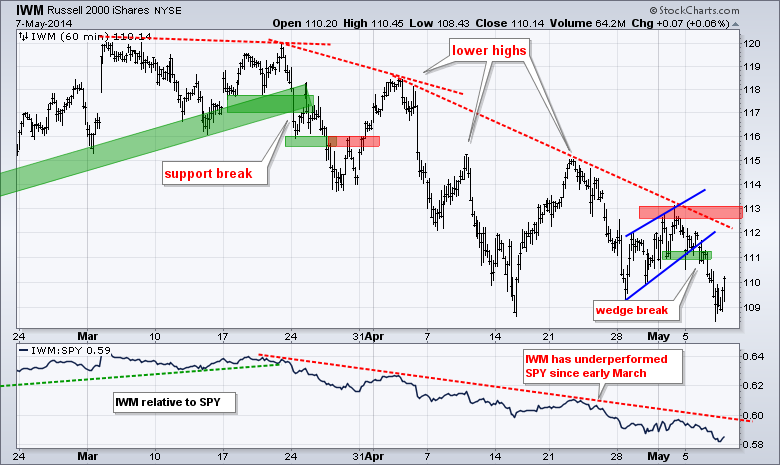
No change. IWM remains in a nine-week downtrend and continues to underperform SPY. IWM bounced last week, but formed a bearish wedge and broke wedge support this week. The break signals yet another continuation lower. Chartists can now set key resistance at 113. The indicator window shows the price relative (IWM:SPY ratio) near multi-month lows.
**************************************************************
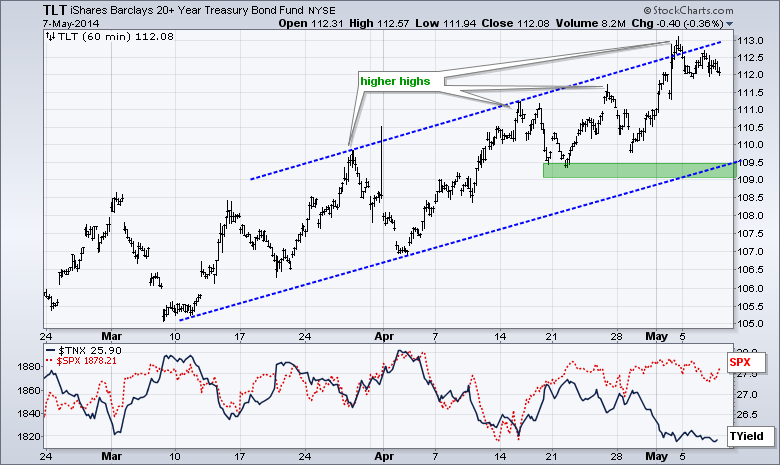
No change. Despite some positive economic reports last week, the 20+ YR T-Bond ETF (TLT) continued higher and finished at a new high for the move. This puts the ETF just above the upper trend line of the rising channel and makes it overbought. The lower trend line and mid April lows combine to mark key support in the 109-109.5 area.
**************************************************************
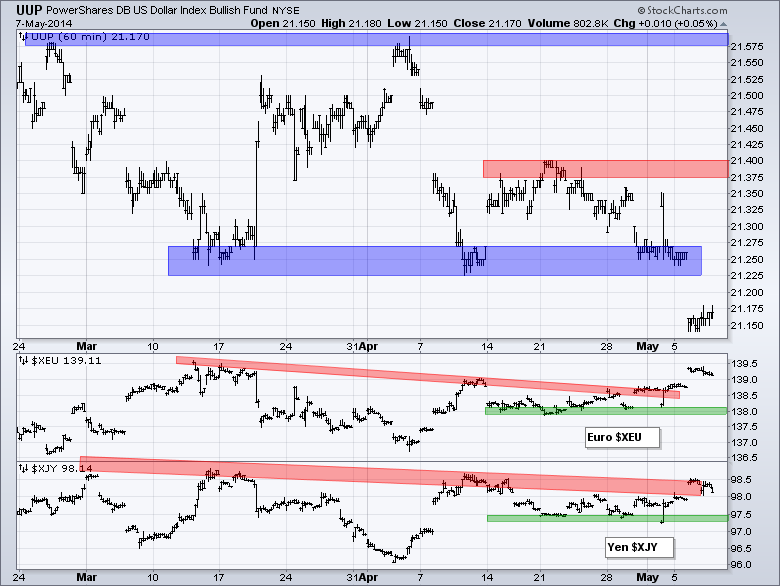
No change. The US Dollar ETF (UUP) broke below its March-April lows to extend its downtrend. Falling US interest rates are weighing on the Dollar. The mid April high becomes resistance in the 21.40 area. The Euro Index ($XEU) broke out this week and chartists can mark support in the 138 area.
**************************************************************
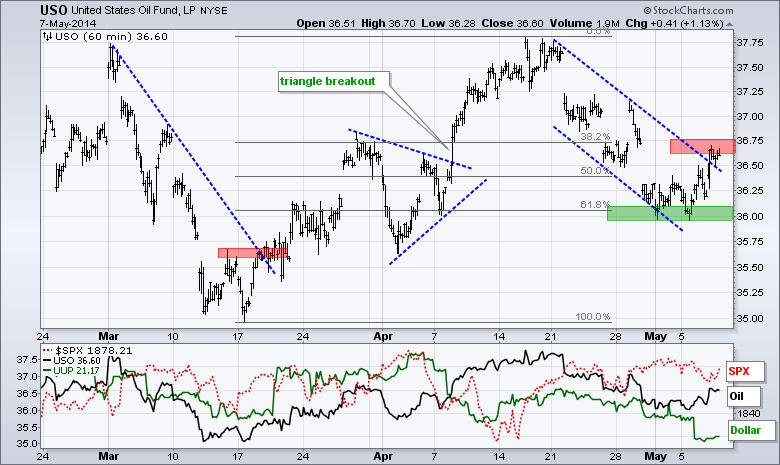
No change. The USO Oil Fund (USO) fell sharply and has now retraced 62% of the advance from mid March to mid April. The bigger trend for oil is up and this is still considered a correction within that uptrend. The falling channel defines this correction and I will mark resistance at 36.75. A break above this level would end the correction and signal a resumption of the bigger uptrend.
**************************************************************
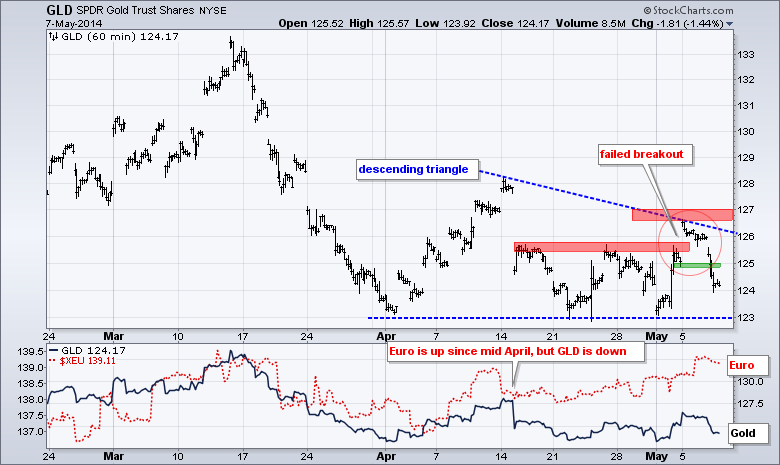
Gold could not break above 128 when tensions were running high in Ukraine. Further more, the Dollar remains weak and gold formed a lower high just below 127. The bigger trend for gold is down and is looks like GLD is forming a bearish descending triangle. A move below 123 would signal a continuation lower and target a move to the 118 area.
***************************************************************
Key Reports and Events (all times Eastern):
Thu - May 08 - 08:30 - Initial Jobless Claims
Thu - May 08 - 08:30 - European Central Bank (ECB) Policy Statement
Thu - May 08 - 10:30 - Natural Gas Inventories
Fri - May 09 - 10:00 - JOLTS - Job Openings
This commentary and charts-of-interest are designed to stimulate thinking. This analysis is not a recommendation to buy, sell, hold or sell short any security (stock ETF or otherwise). We all need to think for ourselves when it comes to trading our own accounts. First, it is the only way to really learn. Second, we are the only ones responsible for our decisions. Think of these charts as food for further analysis. Before making a trade, it is important to have a plan. Plan the trade and trade the plan. Among other things, this includes setting a trigger level, a target area and a stop-loss level. It is also important to plan for three possible price movements: advance, decline or sideways. Have a plan for all three scenarios BEFORE making the trade. Consider possible holding times. And finally, look at overall market conditions and sector/industry performance.


