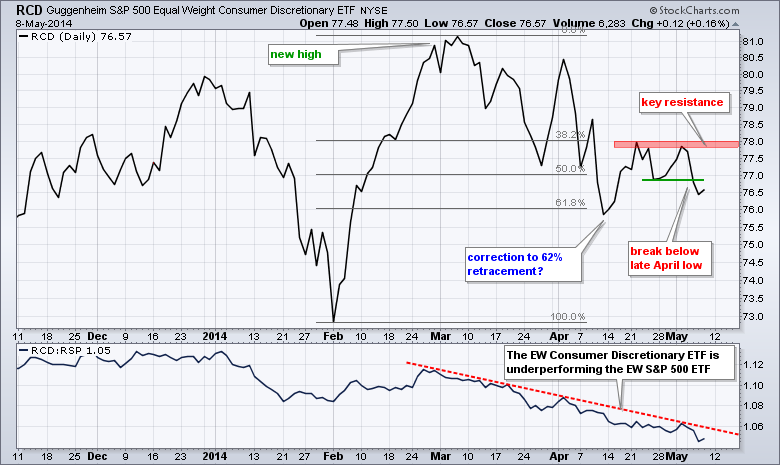
The bulls tried to rally the market in early trading, but the early gains failed to hold as stocks moved lower in the afternoon. Once again, the Russell 2000 ETF and Russell MicroCap iShares led the way lower. The Nasdaq 100 ETF, Dow Diamonds and S&P 500 SPDR finished unchanged and held up relatively well. The energy and utilities sectors were hit, but these sectors were the top performers over the last three months and ripe for a rest. The chart below shows the Equal-Weight Consumer Discretionary ETF (RCD) breaking below its late April low and continuing to underperform the Equal-Weight S&P 500 ETF (RSP). Even though the RCD hit a new high in early March and remains near the 62% retracement here in early May, the immediate trend is down and a break above the late April high is needed to reverse this downtrend. Relative weakness in this key sector is also a major drag on the market.
**This chart analysis is for educational purposes only, and should not
be construed as a recommendation to buy, sell or sell-short said securities**
**************************************************************
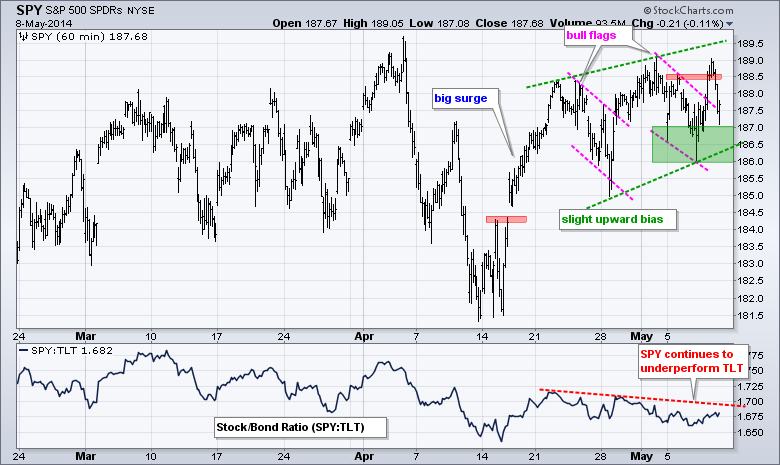
SPY surged above 188.5 and then fell back to close below 188. This pullback is frustrating to bulls, but the bears do not have much to go on either. SPY surged from 181.5 to 188 in mid April and then embarked on a choppy range with two falling flags. This range has a slight upward bias because of the higher highs and higher lows. The green zone marks support in the 186-187 area. The SPY:TLT ratio continues to edge lower and a break above 1.7 would be bullish for stocks. This would signal that stocks are outperforming Treasuries.
**************************************************************
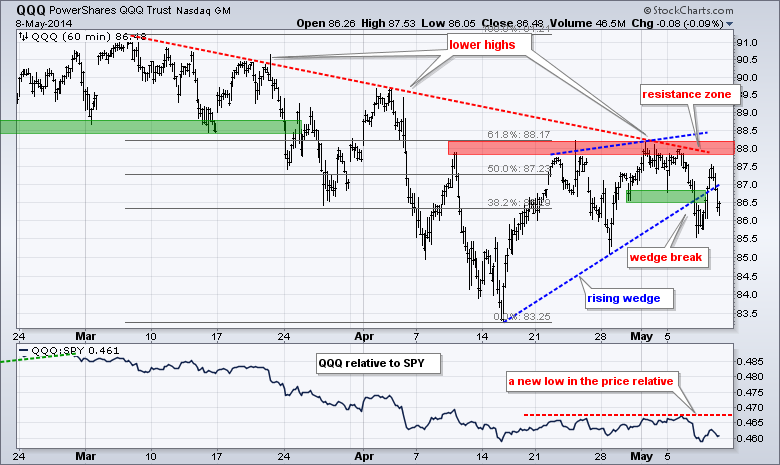
QQQ broke wedge support with a sharp decline on Wednesday and then traded on either side of this break on Thursday. The break is still holding at this point and key resistance remains in the 88 area. The indicator window shows the price relative (QQQ:SPY ratio) hitting a new low as QQQ continues to underperform the broader market. High growth and high valuation are not the places to be right now.
**************************************************************
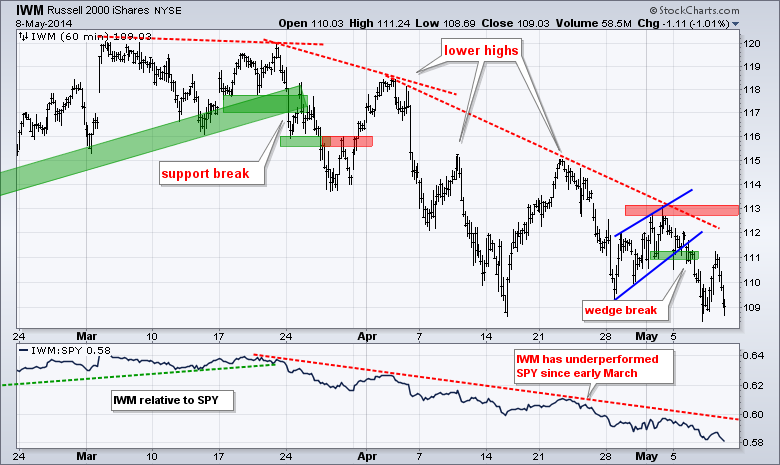
No change. IWM remains in a nine-week downtrend and continues to underperform SPY. IWM bounced last week, but formed a bearish wedge and broke wedge support this week. The break signals yet another continuation lower. Chartists can now set key resistance at 113. The indicator window shows the price relative (IWM:SPY ratio) near multi-month lows.
**************************************************************
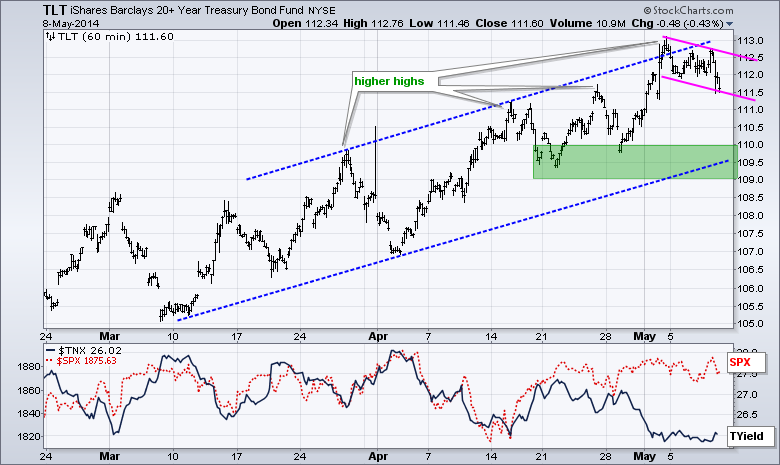
The 20+ YR T-Bond ETF (TLT) hit the upper trend line of the rising channel and fell back this week. This small decline looks like a falling flag and a breakout would signal yet another continuation higher. The lower trend line and late April lows mark a support zone in the 109-110 area.
**************************************************************
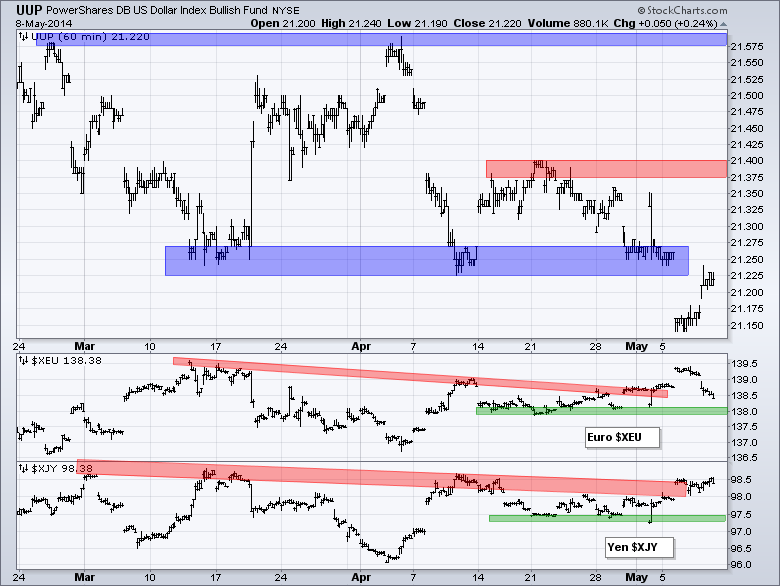
No change. The US Dollar ETF (UUP) broke below its March-April lows to extend its downtrend. Falling US interest rates are weighing on the Dollar. The mid April high becomes resistance in the 21.40 area. The Euro Index ($XEU) broke out this week and chartists can mark support in the 138 area.
**************************************************************
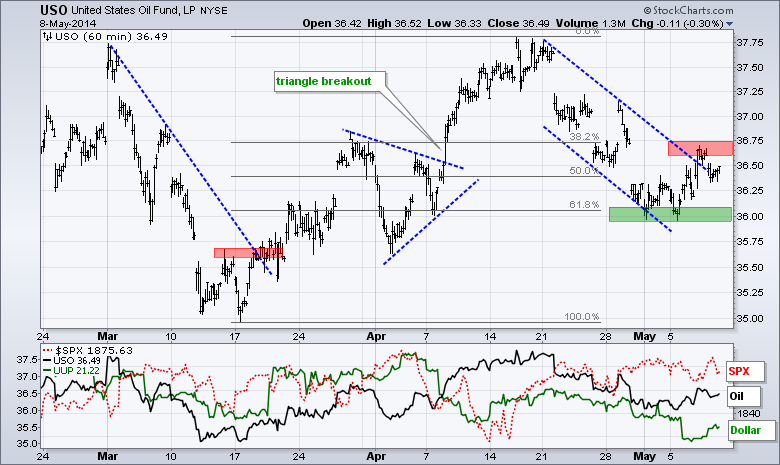
No change. The USO Oil Fund (USO) fell sharply and has now retraced 62% of the advance from mid March to mid April. The bigger trend for oil is up and this is still considered a correction within that uptrend. The falling channel defines this correction and I will mark resistance at 36.75. A break above this level would end the correction and signal a resumption of the bigger uptrend.
**************************************************************
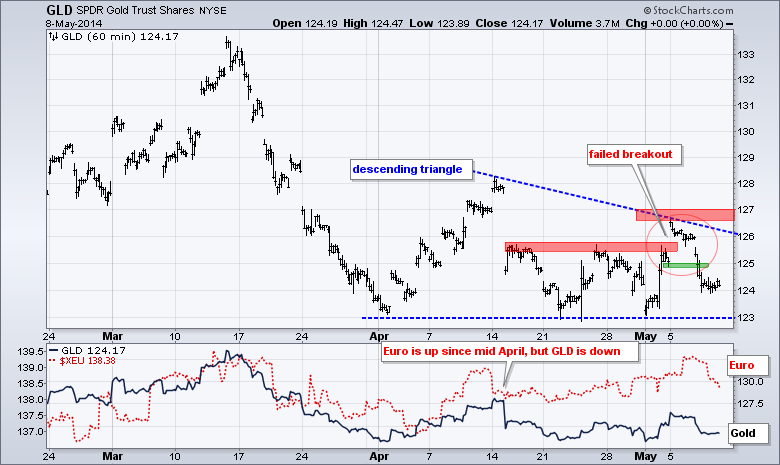
No change. Gold could not break above 128 when tensions were running high in Ukraine. Further more, the Dollar remains weak and gold formed a lower high just below 127. The bigger trend for gold is down and is looks like GLD is forming a bearish descending triangle. A move below 123 would signal a continuation lower and target a move to the 118 area.
***************************************************************
Key Reports and Events (all times Eastern):
Fri - May 09 - 10:00 - JOLTS - Job Openings
This commentary and charts-of-interest are designed to stimulate thinking. This analysis is not a recommendation to buy, sell, hold or sell short any security (stock ETF or otherwise). We all need to think for ourselves when it comes to trading our own accounts. First, it is the only way to really learn. Second, we are the only ones responsible for our decisions. Think of these charts as food for further analysis. Before making a trade, it is important to have a plan. Plan the trade and trade the plan. Among other things, this includes setting a trigger level, a target area and a stop-loss level. It is also important to plan for three possible price movements: advance, decline or sideways. Have a plan for all three scenarios BEFORE making the trade. Consider possible holding times. And finally, look at overall market conditions and sector/industry performance.


