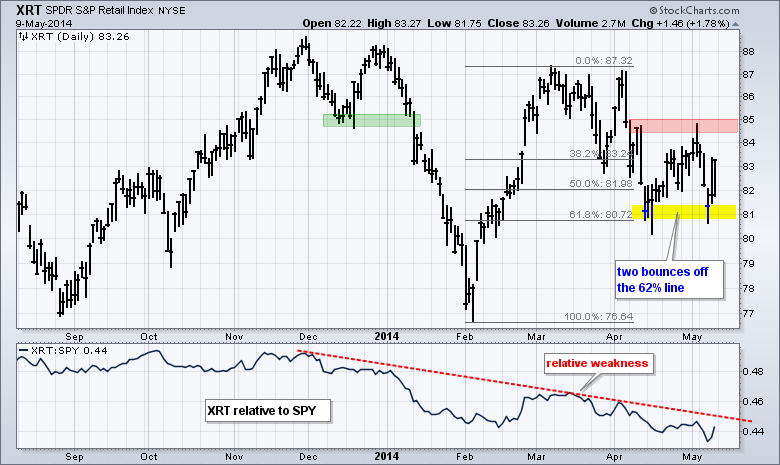
Not much happened in the stock market last week. The Dow Diamonds advanced .59%, the Nasdaq 100 ETF fell .79%, the S&P 500 SPDR decline just .05% and the Russell 2000 ETF lost 1.79%. The nine sector SPDRs were split with four up and five down. The Consumer Discretionary SPDR (XLY) led the way lower with a .64% weekly loss, while the Consumer Staples SPDR (XLP) was the strongest with a .70% weekly gain. The weekly gains and losses, however, were relatively small and subdued. Even though it seems as if there is more selling pressure than buying pressure, the Dow Industrials and S&P 500 are still trading within spitting distance of their prior highs. Overall, I still think the cup is half full and the bulls have a slight edge going forward. Things cannot be that bad if the S&P 500 and Dow are near their all time highs. It is now mid month and this means retail sales for April will be reported on Tuesday. This report will provide more insights into the spring season. Retail stocks were all over the place last week as the Retail SPDR (XRT) fell below 82 on Wednesday and recovered to close above 83 on Friday. The chart below shows the ETF bouncing twice off the 62% retracement area and a close above 85 would be bullish. The indicator window shows the price relative (XRT:SPY ratio) falling since early December as XRT underperforms the market. A trend line break would provide the first sign that relative strength is returning.
**This chart analysis is for educational purposes only, and should not
be construed as a recommendation to buy, sell or sell-short said securities**
**************************************************************
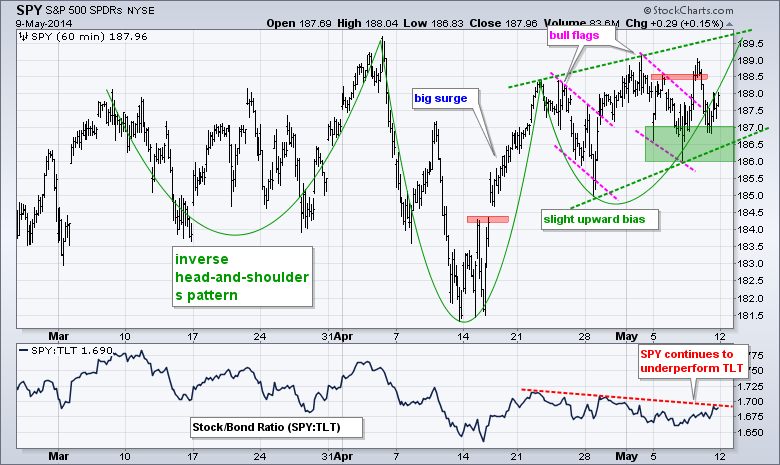
Not much change. SPY surged above 188.5 on Thursday morning, but quickly fell back and closed below 188 on Friday. This pullback is frustrating to bulls, but the bears do not have much to go on either. SPY surged from 181.5 to 188 in mid April and then embarked on a choppy range with two falling flags. This range has a slight upward bias because of the higher highs and higher lows. The green zone marks support in the 186-187 area. The SPY:TLT ratio continues to edge lower and a break above 1.7 would be bullish for stocks. This would signal that stocks are outperforming Treasuries.
**************************************************************
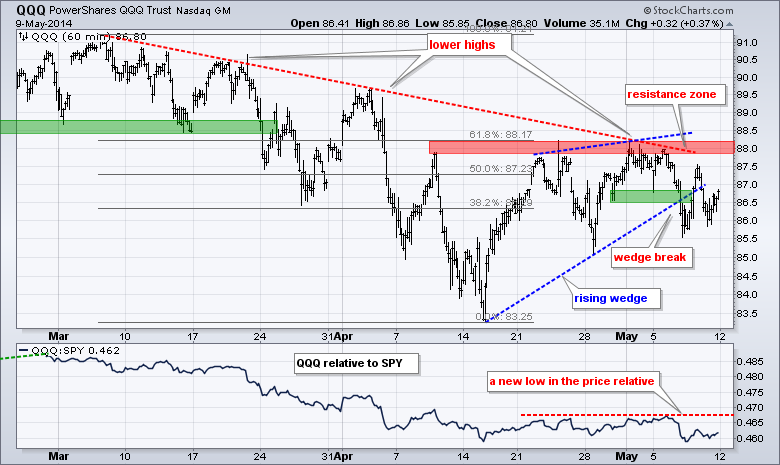
QQQ broke wedge support with a sharp decline on Wednesday and then traded on either side of this break on Thursday-Friday. The break is still holding at this point and key resistance remains in the 88 area. The indicator window shows the price relative (QQQ:SPY ratio) hitting a new low as QQQ continues to underperform the broader market.
**************************************************************
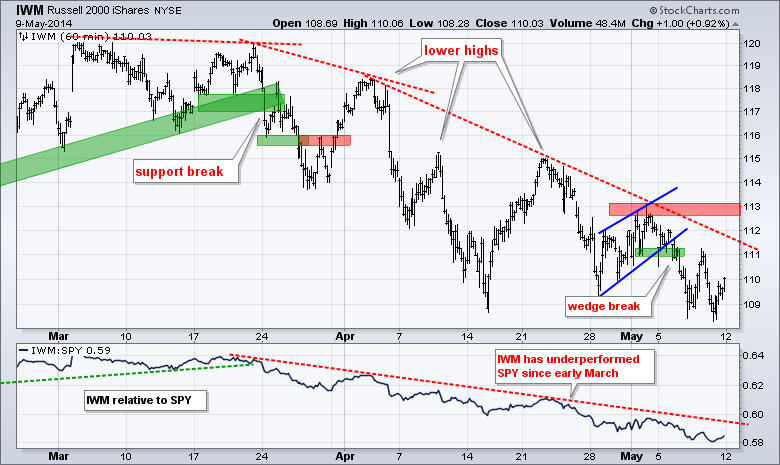
No change. IWM remains in a nine-week downtrend and continues to underperform SPY. IWM bounced last week, but formed a bearish wedge and broke wedge support this week. The break signals yet another continuation lower. Chartists can now set key resistance at 113. The indicator window shows the price relative (IWM:SPY ratio) near multi-month lows.
**************************************************************
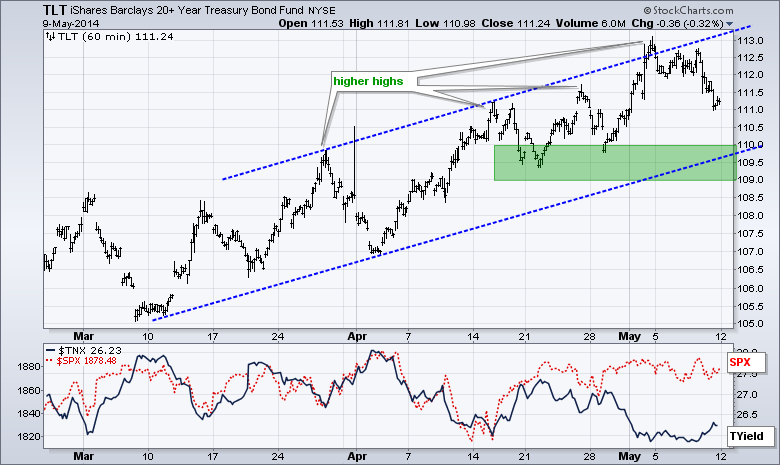
No change. The 20+ YR T-Bond ETF (TLT) hit the upper trend line of the rising channel and fell back last week. This small decline looks like a falling flag and a breakout would signal yet another continuation higher. The lower trend line and late April lows mark a support zone in the 109-110 area.
**************************************************************
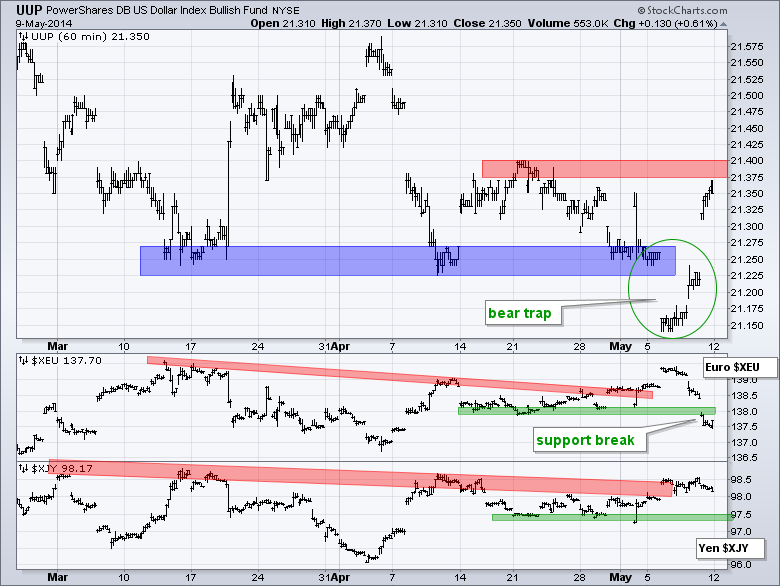
The US Dollar ETF (UUP) broke support, but this support break did not hold as the ETF surged back above the 21.3 area on Friday. This is a bear trap. Also notice that the Euro Index ($XEU) did not hold its breakout and fell below support at 138. The combination is Dollar bullish and Euro bearish. UUP has one more resistance level in the way (21.4) and a breakout here would complete the reversal.
**************************************************************
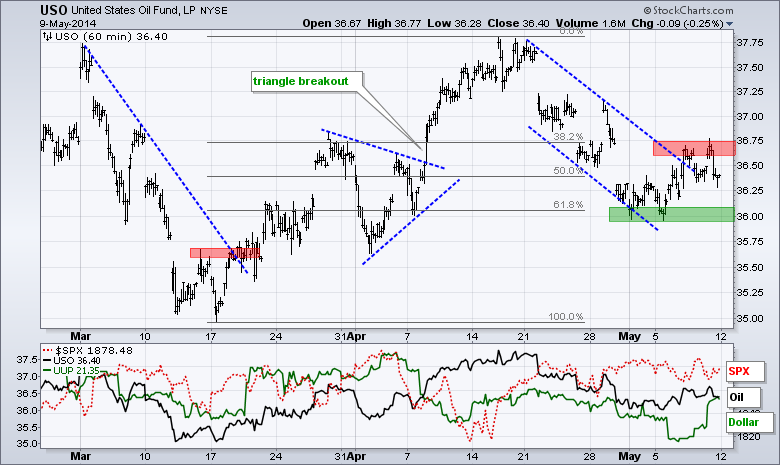
The USO Oil Fund (USO) retraced 62% of the prior advance with a falling channel and broke above the upper trend line last week. Oil traded choppy after the breakout as USO stalled in the 36.5 area on Thursday-Friday. A follow through above 36.75 would complete the breakout and argue for a continuation of the March-April advance.
**************************************************************
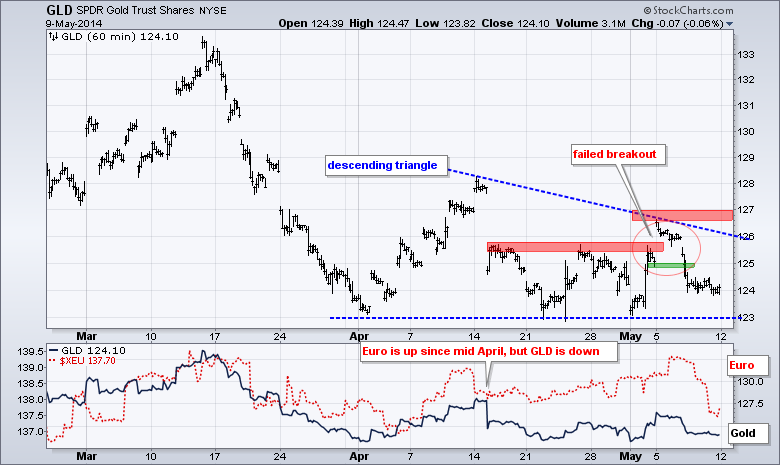
No change. Gold could not break above 128 when tensions were running high in Ukraine. Further more, the Dollar remains weak and gold formed a lower high just below 127. The bigger trend for gold is down and is looks like GLD is forming a bearish descending triangle. A move below 123 would signal a continuation lower and target a move to the 118 area.
***************************************************************
Key Reports and Events (all times Eastern):
Tue - May 13 - 08:30 - Retail Sales
Tue - May 13 - 10:00 - Business Inventories
Wed - May 14 - 07:00 - MBA Mortgage Index
Wed - May 14 - 08:30 - Producer Price Index (PPI)
Wed - May 14 - 10:30 - Crude Oil Inventories
Thu - May 15 - 08:30 - Initial Jobless Claims
Thu - May 15 - 08:30 - Consumer Price Index (CPI)
Thu - May 15 - 08:30 - Empire State Manufacturing
Thu - May 15 - 09:15 - Industrial Production
Thu - May 15 - 10:00 - Philadelphia Fed Index
Thu - May 15 - 10:00 - NAHB Housing Market Index
Thu - May 15 - 10:30 - Natural Gas Inventories
Fri - May 16 - 08:30 - Housing Starts/Building Permits
Fri - May 16 - 09:55 - Michigan Sentiment
This commentary and charts-of-interest are designed to stimulate thinking. This analysis is not a recommendation to buy, sell, hold or sell short any security (stock ETF or otherwise). We all need to think for ourselves when it comes to trading our own accounts. First, it is the only way to really learn. Second, we are the only ones responsible for our decisions. Think of these charts as food for further analysis. Before making a trade, it is important to have a plan. Plan the trade and trade the plan. Among other things, this includes setting a trigger level, a target area and a stop-loss level. It is also important to plan for three possible price movements: advance, decline or sideways. Have a plan for all three scenarios BEFORE making the trade. Consider possible holding times. And finally, look at overall market conditions and sector/industry performance.


