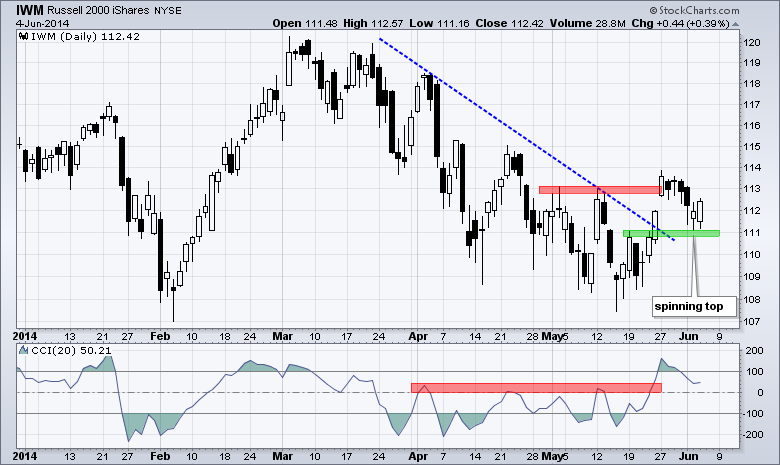
Stocks edged higher on Wednesday with the major index ETFs posting modest gains. The economic reports continue to be positive with the ISM Services Index coming in well above 50 and the ADP report showing 179000 new private sector jobs. Also note that the Fed's beige book showed signs of a spring thaw. Overall, the large-cap indices continue to grind higher as SPY recorded another new high. There are positive signs also within the market. The Retail SPDR (XRT) perked up with a .76% gain, the Semiconductor SPDR (XSD) hit a new high with a 1.42% surge and the Russell 2000 ETF (IWM) is trying to hold the trend line break. The chart below shows IWM breaking out with a surge above 111 in late May and this area turning support as a small spinning top formed on Tuesday. The ETF bounced off this level early Wednesday and closed above 112. The indicator window shows the Commodity Channel Index (CCI) breaking above its resistance zone and this is bullish for momentum. A close below 111 in IWM and a CCI break back into negative territory would negate these breakouts.
**This chart analysis is for educational purposes only, and should not
be construed as a recommendation to buy, sell or sell-short said securities**
*************************************************************
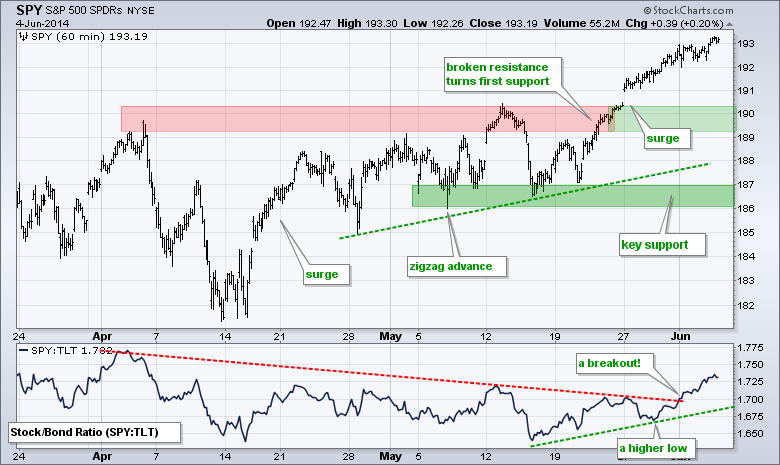
SPY remains in an uptrend with broken resistance turning first support in the 189-190 area. Notice that the SPY:TLT ratio broke out and stocks are now outperforming bonds.
**************************************************************
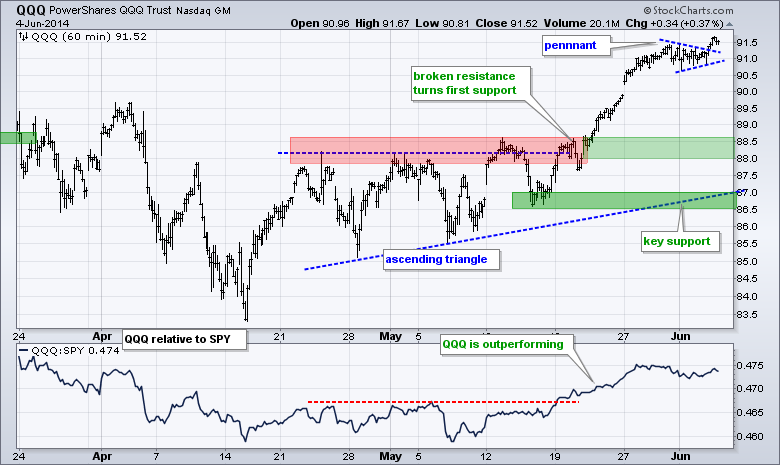
QQQ stalled in the 91 area and formed a small pennant. The trend is up and the pennant breakout signals a continuation of this advance. The pennant lows mark a minor support level. Broken resistance turns into the first significant support zone in the 88-88.5 area.
**************************************************************
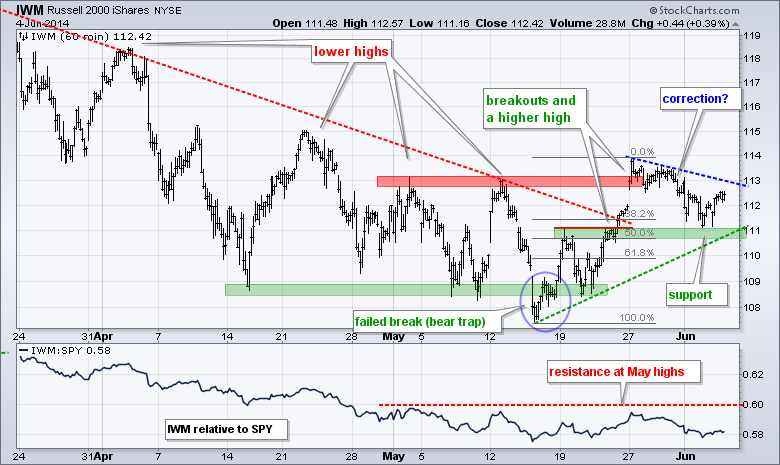
IWM fell back over the last eight days and this could be just a correction after the breakout. Broken resistance, the mid May trend line and the 50% retracement mark first support in the 110.5-111 area. A break above 113.2 would end the correction and signal a continuation higher.
**************************************************************
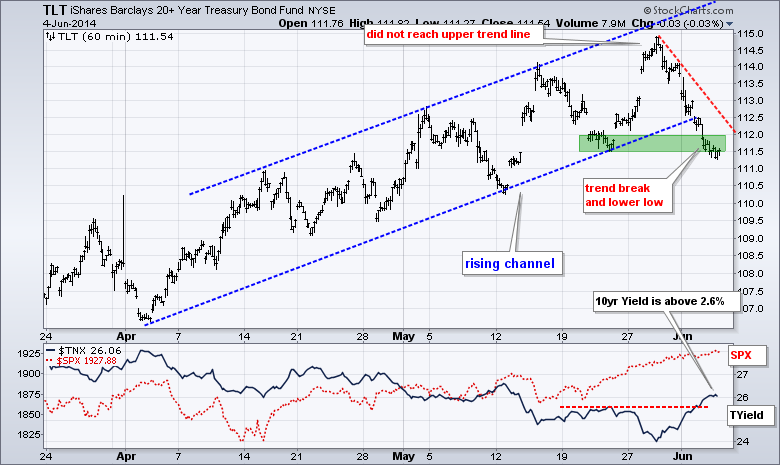
TLT broke the channel trend line and exceeded its prior low to signal the start of a downtrend. The ETF, however, is short-term oversold after a 3% decline the last five days. This may give way to an oversold bounce, but I think the overall trajectory is down for Treasuries right now. Notice that the 10-YR Treasury Yield ($TNX) broke above its late May highs and exceeded 2.6%.
**************************************************************
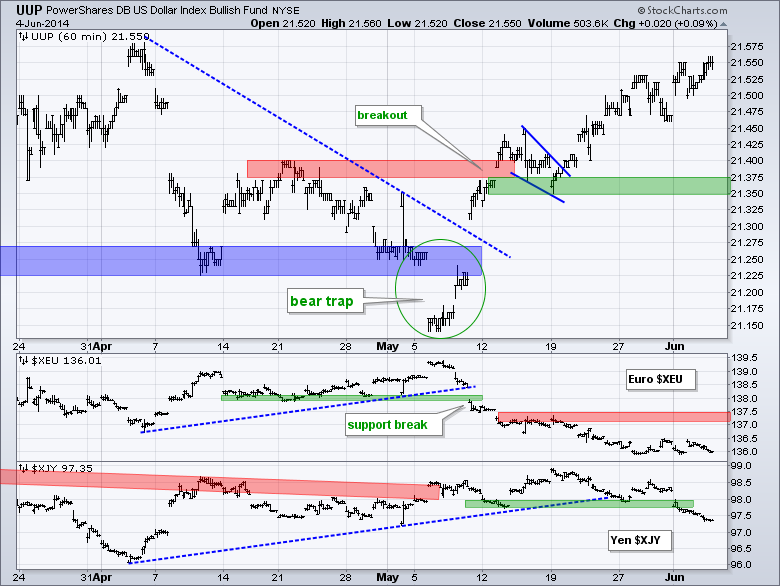
UUP continues to work its way higher after the wedge breakout. A weaker Yen pushed the Dollar higher this week as the Yen Index ($XJY) broke support. The Euro Index ($XEU) remains under pressure as the European Central Bank meeting looms on Thursday. UUP support remains at 21.35 and $XEU resistance is at 137.5.
**************************************************************
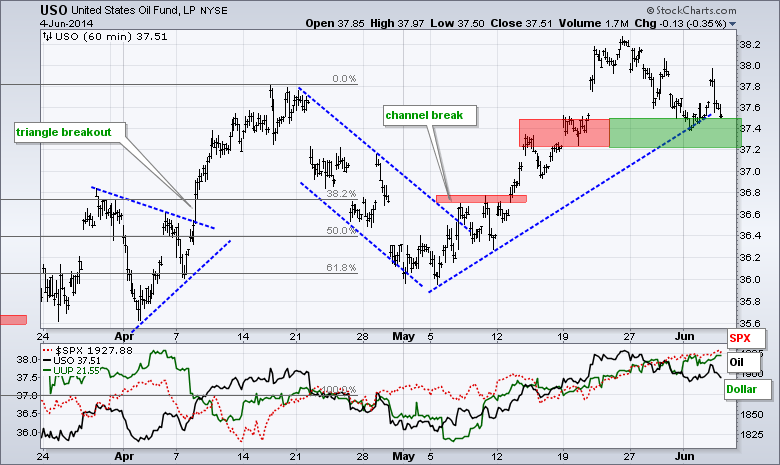
USO got a bounce off the support zone with a small gain on Tuesday, but fell right back on Wednesday. Nevertheless, this move reinforces support in the 37.2-37.4 area, a break of which would reverse the five week upswing.
**************************************************************
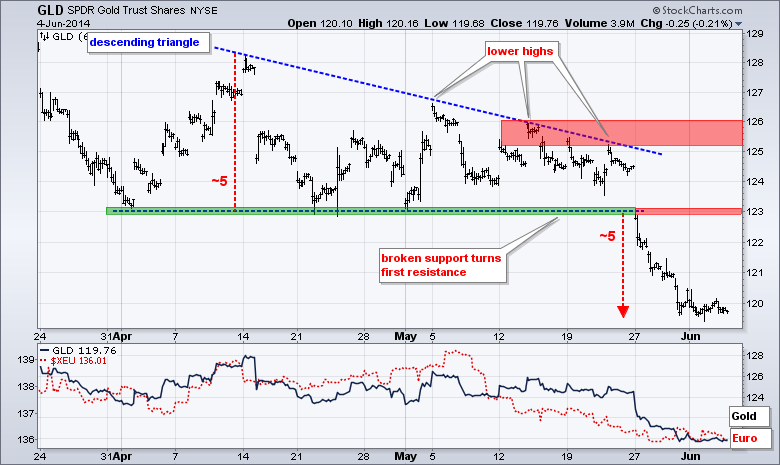
GLD fell sharply and then stalled in the 120 area the last four days. Gold may be oversold, but shows no signs of buying pressure. Broken support turns first resistance in the 123 area.
***************************************************************
Key Reports and Events (all times Eastern):
Thu - Jun 05 - 07:30 - Challenger Job Report
Thu - Jun 05 - 08:30 - Initial Jobless Claims
Thu - Jun 05 - 10:30 - Natural Gas Inventories
Fri - Jun 06 - 08:30 - Employment Report
This commentary and charts-of-interest are designed to stimulate thinking. This analysis is not a recommendation to buy, sell, hold or sell short any security (stock ETF or otherwise). We all need to think for ourselves when it comes to trading our own accounts. First, it is the only way to really learn. Second, we are the only ones responsible for our decisions. Think of these charts as food for further analysis. Before making a trade, it is important to have a plan. Plan the trade and trade the plan. Among other things, this includes setting a trigger level, a target area and a stop-loss level. It is also important to plan for three possible price movements: advance, decline or sideways. Have a plan for all three scenarios BEFORE making the trade. Consider possible holding times. And finally, look at overall market conditions and sector/industry performance.


