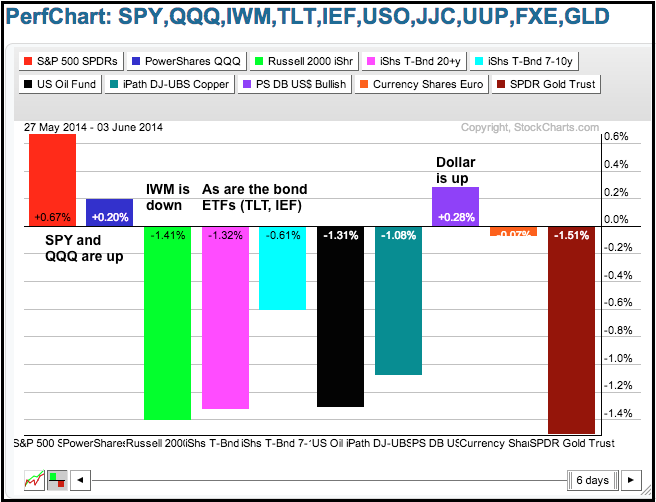
Stocks put in a lackluster performance as the market awaits a data deluge in the coming days. We have the ADP Employment Report, Fed Beige Book and ISM Services today. Initial Claims and the European Central Bank (ECB) meeting are Thursday. And, of course, Friday is non-farm payrolls. Automakers reported robust sales on Tuesday and this suggest that some sort of spring thaw could be underway in consumer spending. The bond market is not taking any chances as the 20+ YR T-Bond ETF (TLT) extended its decline and the 10-YR Treasury Yield ($TNX) surged above the late May high. More positive news on the economy would be negative for bonds and send yields even higher. Note that the S&P 500 SPDR (SPY) is now outperforming the 20+ YR T-Bond ETF (TLT) as the price relative (SPY:TLT ratio) moved to its highest level since early April. Relative strength in stocks over bonds is positive for stocks and this could foreshadow a revival in small-caps. On the PerfChart below, notice that SPY and QQQ are up over the last six days, but IWM is down. Something needs to give here. Also notice that TLT and IEF are down, while the Dollar is up.
**This chart analysis is for educational purposes only, and should not
be construed as a recommendation to buy, sell or sell-short said securities**
*************************************************************
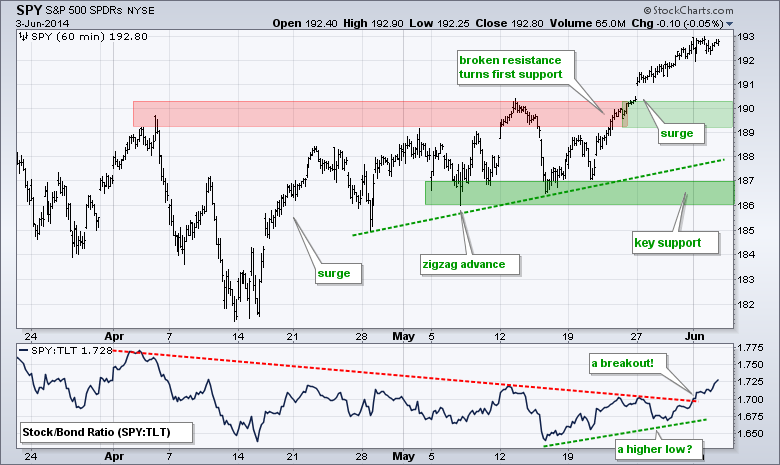
SPY remains in an uptrend with broken resistance turning first support in the 189-190 area. Notice that the SPY:TLT ratio broke out and stocks are now outperforming bonds.
**************************************************************
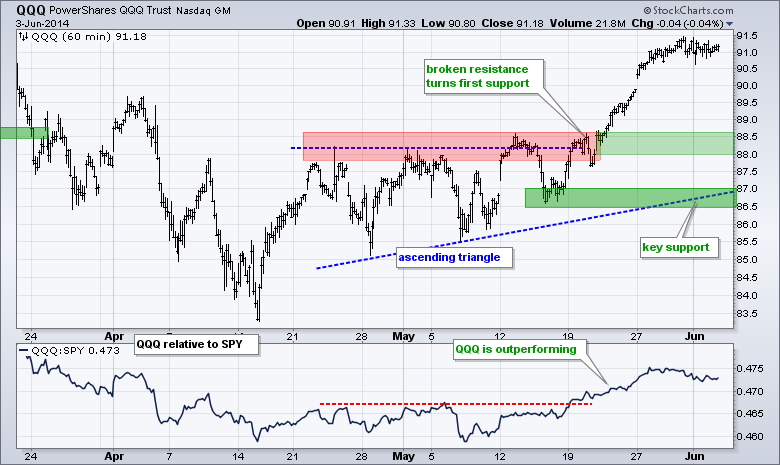
QQQ stalled in the 91 area over the last few days. The trend is up and a breakout at 91.5 would signal a continuation high. Broken resistance turns first support in the 88-88.5 area.
**************************************************************
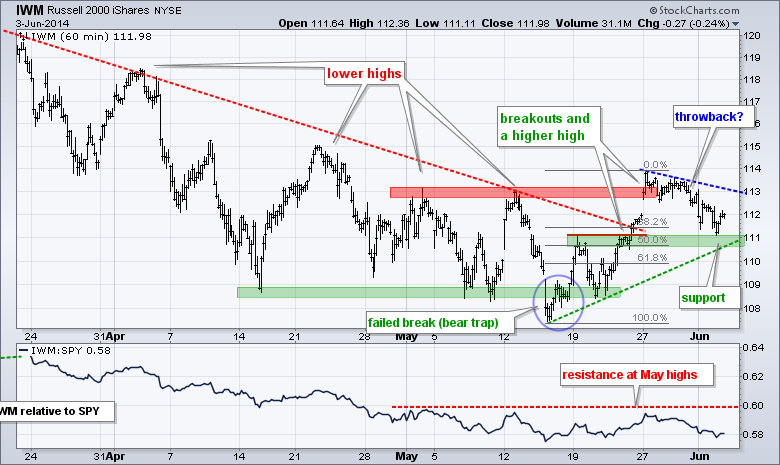
IWM fell back over the last seven days and this could be just a correction after the breakout. Broken resistance, the mid May trend line and the 50% retracement mark first support in the 110.5-111 area. A break above 113.2 would end the correction and signal a continuation higher.
**************************************************************
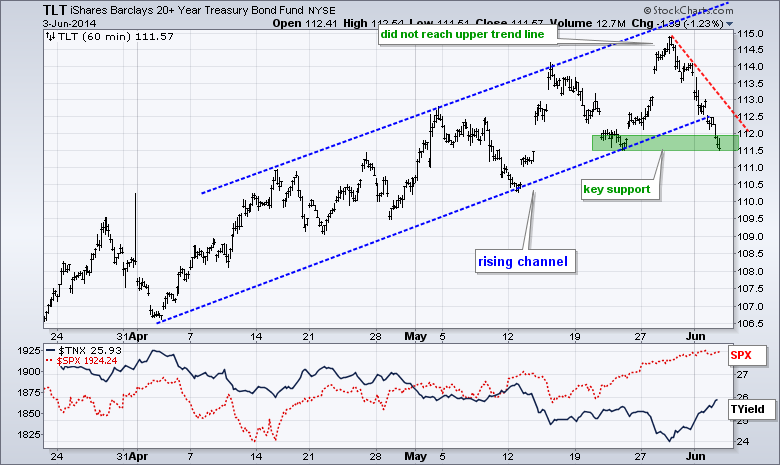
TLT gave up all of its prior gain with a plunge to the late May low in the 111.5 area. This decline broke the channel trend line and the ETF is on the verge of a support break that would fully reverse the short-term uptrend. Given the depth and steepness of the decline, it looks like the bond market is changing its tune and a support break looks likely.
**************************************************************
UUP continues to work its way higher after the wedge breakout. Tuesday's gains were helped by a weaker Yen as the Yen Index ($XJY) broke support. The Euro Index ($XEU) remains under pressure as the European Central Bank meeting looms on Thursday. UUP support remains at 21.35 and $XEU resistance is at 137.5.
http://stockcharts.com/h-sc/ui?s=UUP&p=60&yr=0&mn=2&dy=15&id=p92723391080&a=282328674
**************************************************************
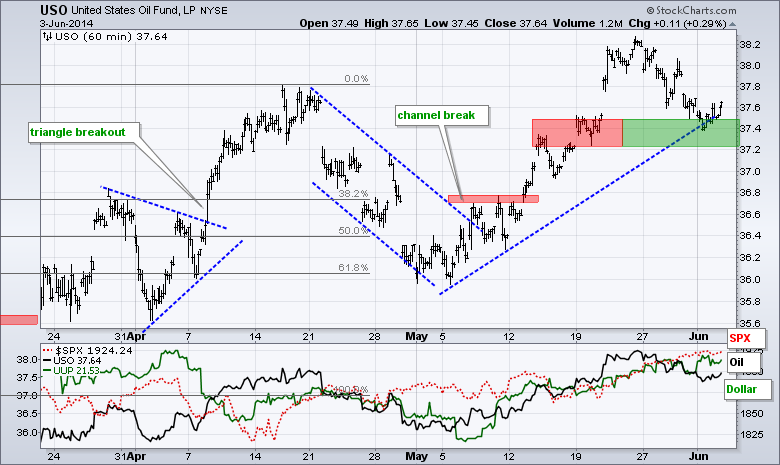
USO got a bounce off the support zone with a small gain on Tuesday. This move reinforces support in the 37.2-37.4 area, a break of which would reverse the upswing.
**************************************************************
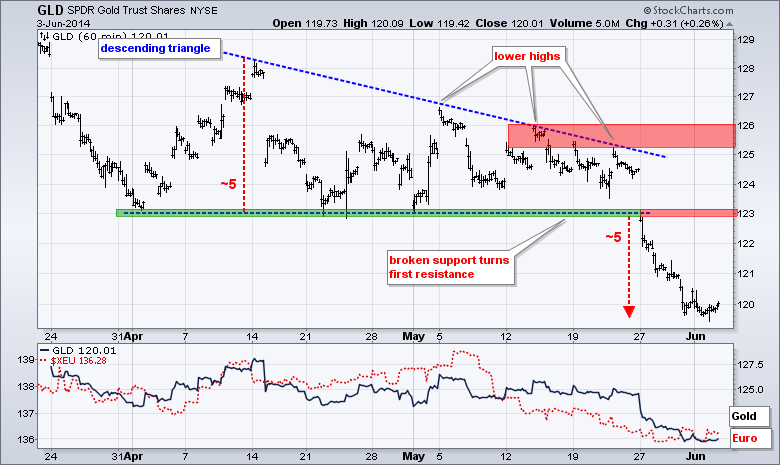
GLD fell sharply and then stalled in the 120 area. Gold may be oversold, but shows no signs of buying pressure. Broken support turns first resistance in the 123 area.
***************************************************************
Key Reports and Events (all times Eastern):
Wed - Jun 04 - 07:00 - MBA Mortgage Index
Wed - Jun 04 - 08:15 - ADP Employment Report
Wed - Jun 04 - 10:00 - ISM Services Index
Wed - Jun 04 - 10:30 - Crude Oil Inventories
Wed - Jun 04 - 14:00 - Fed Beige Book
Thu - Jun 05 - 07:30 - Challenger Job Report
Thu - Jun 05 - 08:30 - Initial Jobless Claims
Thu - Jun 05 - 10:30 - Natural Gas Inventories
Fri - Jun 06 - 08:30 - Employment Report
This commentary and charts-of-interest are designed to stimulate thinking. This analysis is not a recommendation to buy, sell, hold or sell short any security (stock ETF or otherwise). We all need to think for ourselves when it comes to trading our own accounts. First, it is the only way to really learn. Second, we are the only ones responsible for our decisions. Think of these charts as food for further analysis. Before making a trade, it is important to have a plan. Plan the trade and trade the plan. Among other things, this includes setting a trigger level, a target area and a stop-loss level. It is also important to plan for three possible price movements: advance, decline or sideways. Have a plan for all three scenarios BEFORE making the trade. Consider possible holding times. And finally, look at overall market conditions and sector/industry performance.


