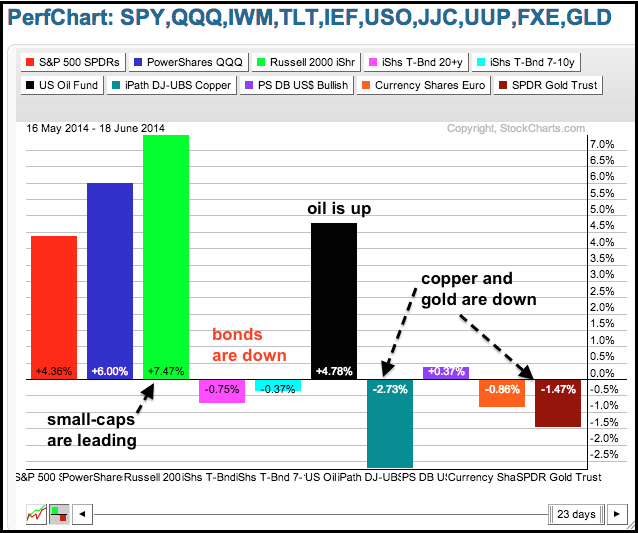
The Yellen Fed came out with a dovish statement on Wednesday. This put a bid into utilities, gold, bonds and stocks. The Dollar and Treasury yields moved lower. The gains in the major index ETFs were modest, but enough to extend the short-term uptrends. The Utilities SPDR surged over 2% on the prospect that interest rates will remain low forever. The Materials SPDR surged over 1% as Air Products gained over 7%. The Dow Transports gained 1.51% on the heels of a 6% surge in FedEx. The inter-market PerfChart below shows stocks leading the way over the past month. Oil is also up after the Iraq-induced surge last week. The two Treasury bond ETFs are down, but not by much.
**This chart analysis is for educational purposes only, and should not
be construed as a recommendation to buy, sell or sell-short said securities**
**************************************************************
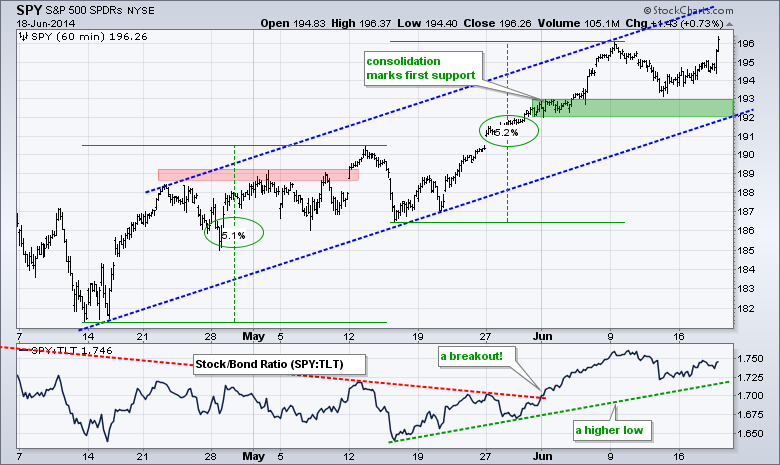
SPY moved to a new high after the FOMC. Overall, the ETF is advancing within a rising channel that extends back to mid April. The early June consolidation and mid June low combine to mark key support in the 192-193 area. The April trend line will extend to this area next week.
**************************************************************
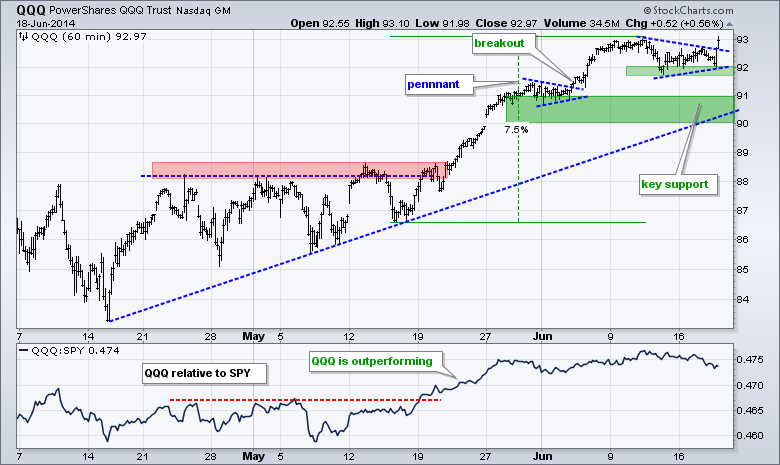
QQQ broke pennant resistance in early June and surged to a new high. Another pennant formed in mid June and the ETF broke out with another surge on Wednesday. The mid June lows mark the first support zone in the 91.8-92 area. The early June lows, the mid April trend line and a buffer mark a key support zone in the 90-91 area.
**************************************************************
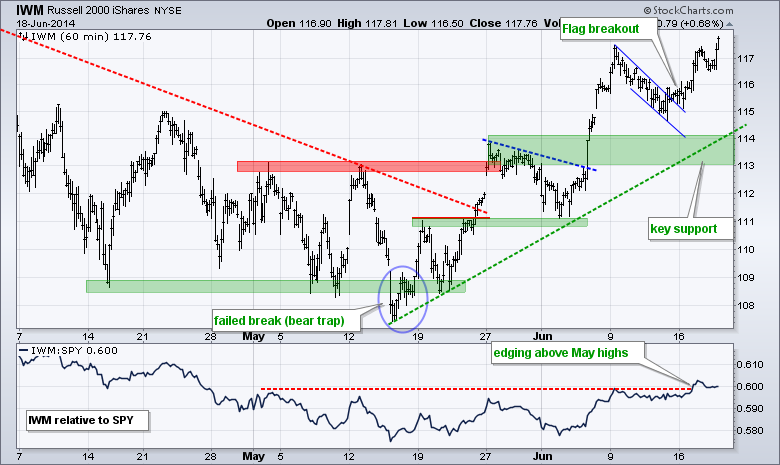
No change. IWM broke flag resistance on Friday and the breakout held with further gains this week. Broken resistance and the mid May trend line combine to mark support in the 113-114 area. The indicator window shows the price relative edging above the May highs as small-caps start to outperform large-caps again.
**************************************************************
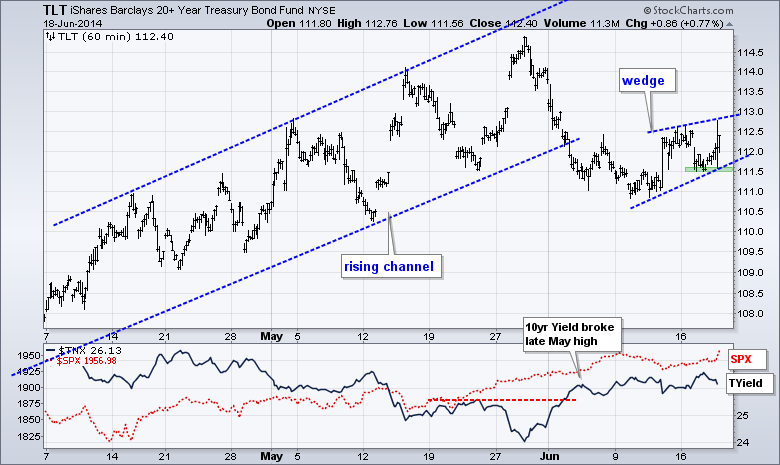
The economy may be plugging along, the labor market may be improving and inflation may be on target, but the Yellen Fed remains dovish and bonds got a bounce. TLT appeared to break down in early June with a move below the lower trend line of a rising channel. The ETF, however, managed to firm in the 111-111.5 area the last two weeks and a rising wedge is taking shape now. The immediate trend is up as long as this wedge rises. A break below 111.4 would end the wedge and be bearish.
**************************************************************
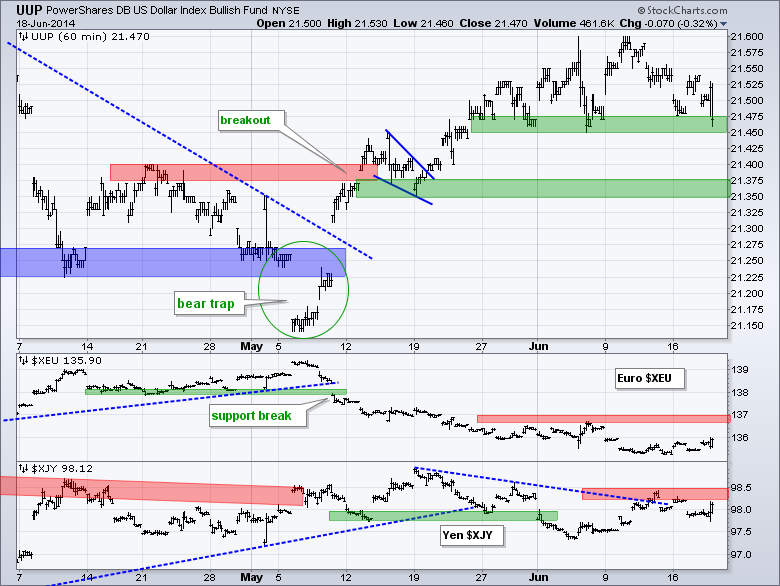
The Dollar also got juked with the dovish Fed as the US Dollar ETF (UUP) fell back to support in the 21.45 area. Even though a break below this first support zone would be negative, I would watch the Euro Index ($XEU) more. A break above 137 in the Euro would be Euro bullish and Dollar bearish.
**************************************************************
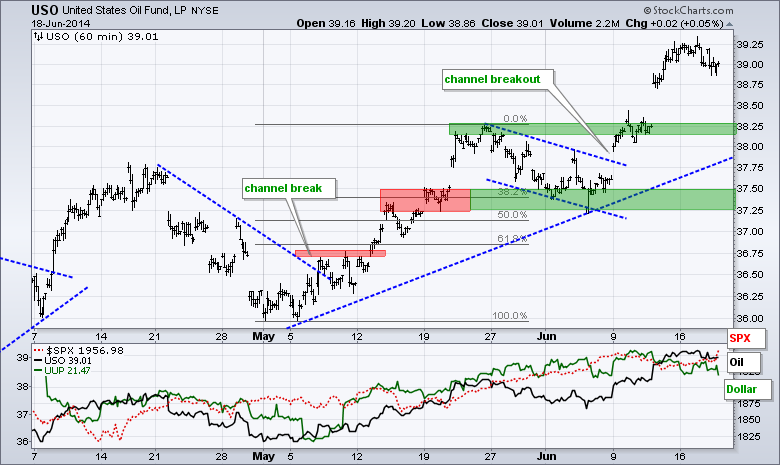
No change. USO continued higher with a surge above 39 and Spot Light Crude ($WTIC) broke above a key resistance zone on the daily chart. Broken resistance in the 38.25 area turns first support for USO. I will leave key support in the 37.25-37.5 area for now.
**************************************************************
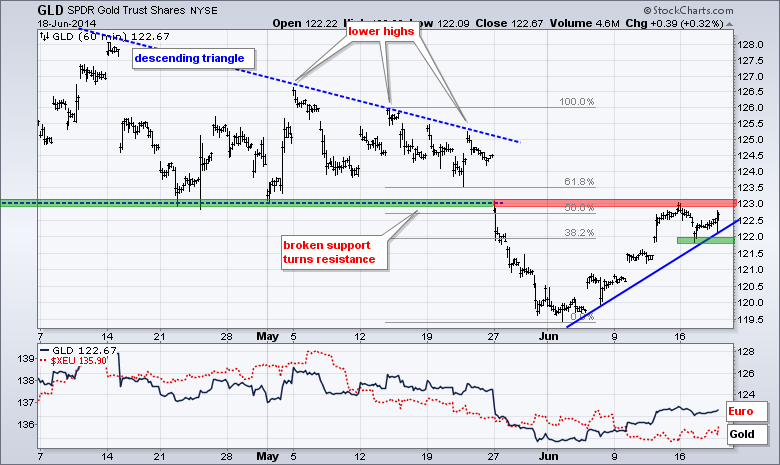
Gold may like the dovish Fed as well. The Gold SPDR (GLD) bottomed around 119.5 and advanced above 122 this month. The three week trend is up with this week's low marking first support. Overall, GLD has resistance in the 123 area from broken support, but may well just punch through this level. Further strength would not, however, change the medium-term or long-term trends, which remain down.
***************************************************************
Key Reports and Events (all times Eastern):
Thu - Jun 19 - 08:30 - Initial Jobless Claims
Thu - Jun 19 - 10:00 - Philadelphia Fed Report
Thu - Jun 19 - 10:00 - Leading Economic Indicators
Thu - Jun 19 - 10:30 - Natural Gas Inventories
Fri - Jun 20 - 10:30 - Happy Friday!
This commentary and charts-of-interest are designed to stimulate thinking. This analysis is not a recommendation to buy, sell, hold or sell short any security (stock ETF or otherwise). We all need to think for ourselves when it comes to trading our own accounts. First, it is the only way to really learn. Second, we are the only ones responsible for our decisions. Think of these charts as food for further analysis. Before making a trade, it is important to have a plan. Plan the trade and trade the plan. Among other things, this includes setting a trigger level, a target area and a stop-loss level. It is also important to plan for three possible price movements: advance, decline or sideways. Have a plan for all three scenarios BEFORE making the trade. Consider possible holding times. And finally, look at overall market conditions and sector/industry performance.


