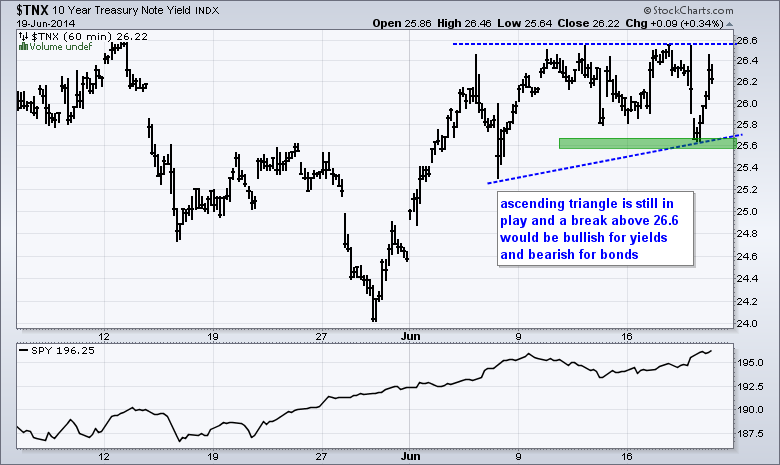
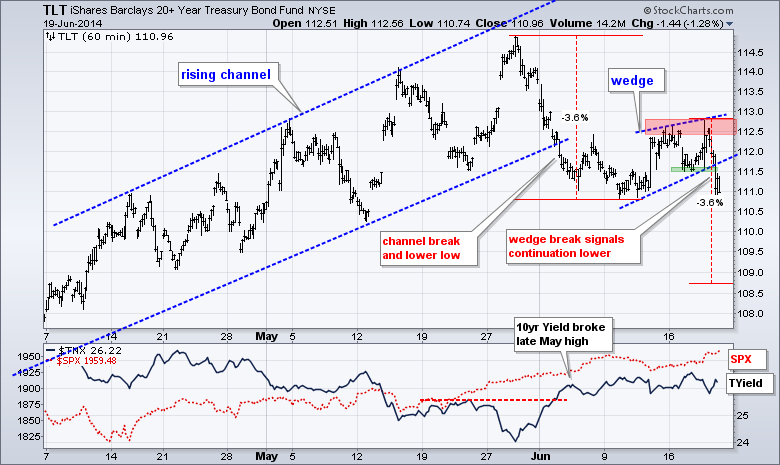
Stocks did not do much, but it was a most interesting day elsewhere. The major index ETFs closed fractionally higher and the sectors were mixed. The consumer discretionary, technology and finance sectors were fractionally lower. The energy, consumer staples and utilities sectors were modestly higher. Gold and silver miners surged as precious metals moved sharply higher. The thinking was that a dovish Fed is bullish for utilities, precious metals and the Euro. The 10-YR Treasury Yield ($TNX), however, actually moved higher and remained within its two week consolidation. Watch what the Fed does, not what the Fed says. Similarly, watch the bond market for the real clues on Fed policy. The 10-YR Treasury Yield has yet to break out, but I was impressed with its ability to hold above 2.6%. Also note that the 20+ YR T-Bond ETF broke wedge support. The bond market may not be as ready to believe the dovish Fed.
**This chart analysis is for educational purposes only, and should not
be construed as a recommendation to buy, sell or sell-short said securities**
**************************************************************
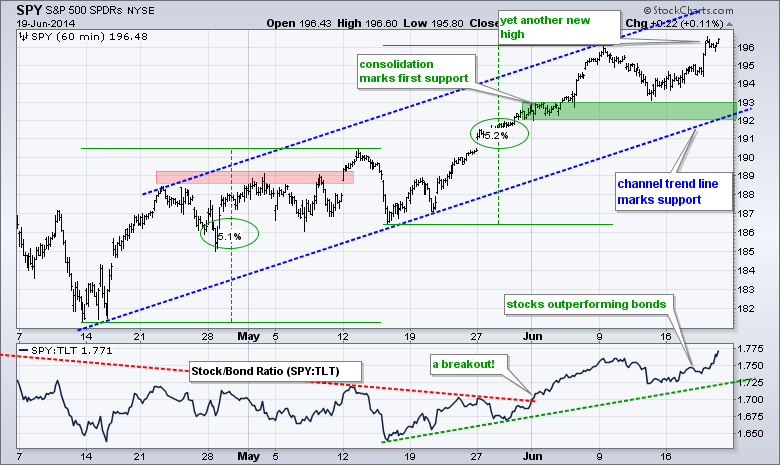
No change. SPY moved to a new high after the FOMC. Overall, the ETF is advancing within a rising channel that extends back to mid April. The early June consolidation and mid June low combine to mark key support in the 192-193 area. The April trend line will extend to this area next week.
**************************************************************
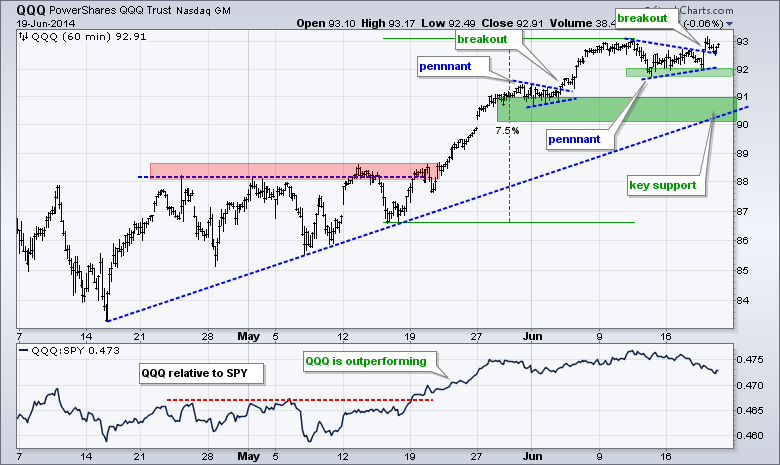
No change. QQQ broke pennant resistance in early June and surged to a new high. Another pennant formed in mid June and the ETF broke out with another surge on Wednesday. The mid June lows mark the first support zone in the 91.8-92 area. The early June lows, the mid April trend line and a buffer mark a key support zone in the 90-91 area.
**************************************************************
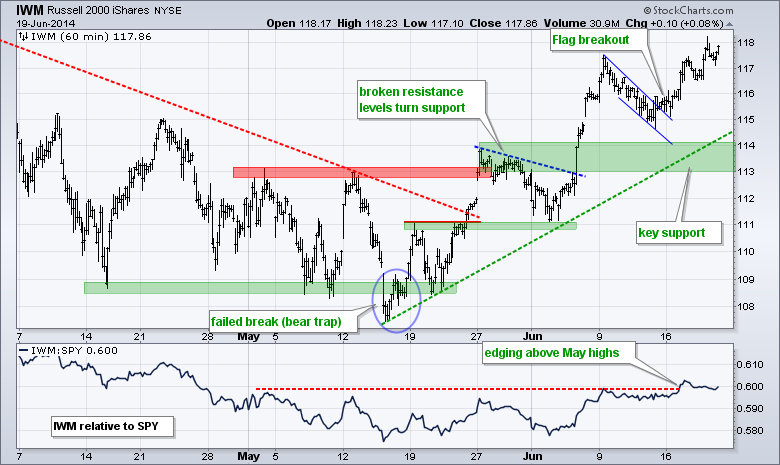
No change. IWM broke flag resistance on Friday and the breakout held with further gains this week. Broken resistance and the mid May trend line combine to mark support in the 113-114 area. The indicator window shows the price relative edging above the May highs as small-caps start to outperform large-caps again.
**************************************************************
The 20+ YR T-Bond ETF (TLT) broke wedge support to signal a continuation of the prior decline, which was 3.6%. A similar decline from the wedge highs would project further weakness to the 108.5-109 area. Broken support turns first resistance in the 111.5 area. This week's highs mark key resistance in the 112.5-112.8 area.
**************************************************************
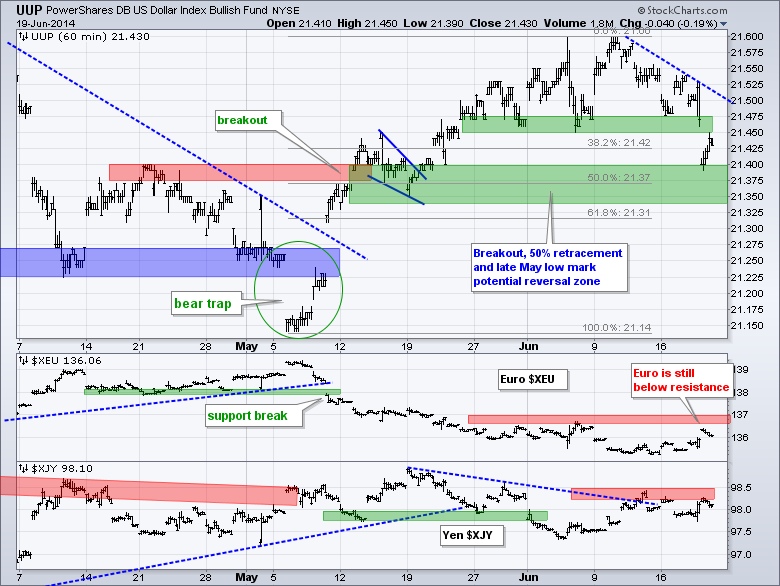
The US Dollar ETF (UUP) moved sharply lower on the open, but bounced and closed off its low. The immediate trend is down with the decline over the last eight days. This still looks like a correction after the breakout-surge in May. The breakout zone, 50% retracement and late May low combine to mark a potential reversal zone in the 21.35-21.40 area. The Euro Index ($XEU) is still below resistance at 137, a break of which would be Euro bullish and Dollar bearish.
**************************************************************
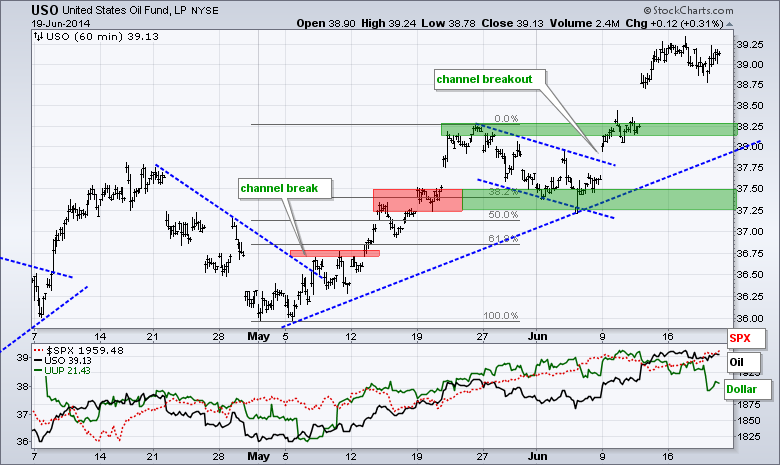
No change. USO continued higher with a surge above 39 and Spot Light Crude ($WTIC) broke above a key resistance zone on the daily chart. Broken resistance in the 38.25 area turns first support for USO. I will leave key support in the 37.25-37.5 area for now.
**************************************************************
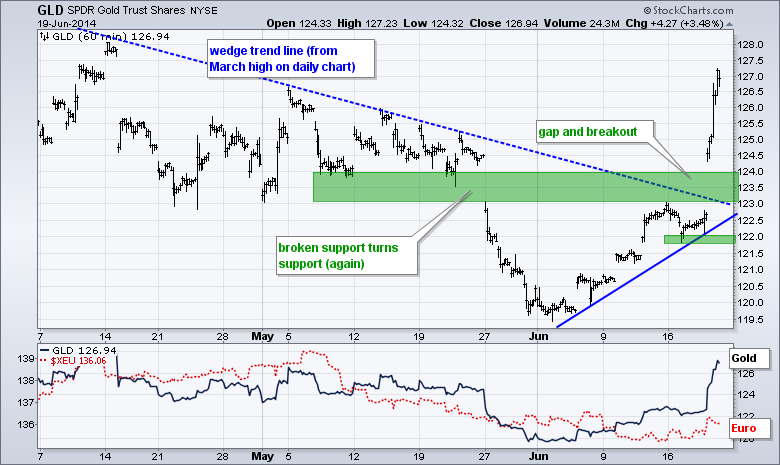
So much for resistance in the 123 area. The Gold SPDR (GLD) blew through this resistance zone with a gap and surge above 126. Looks like some short covering and new buying came together for this big move. On the daily chart, GLD held above its December low and broke wedge resistance to signal a continuation of the surge from late December to mid March. GLD is obviously overbought right now and the broken resistance zone turns first support in the 123-124 area.
***************************************************************
Key Reports and Events (all times Eastern):
Thu - Jun 19 - 08:30 - Initial Jobless Claims
Thu - Jun 19 - 10:00 - Philadelphia Fed Report
Thu - Jun 19 - 10:00 - Leading Economic Indicators
Thu - Jun 19 - 10:30 - Natural Gas Inventories
Fri - Jun 20 - 10:30 - Happy Friday!
This commentary and charts-of-interest are designed to stimulate thinking. This analysis is not a recommendation to buy, sell, hold or sell short any security (stock ETF or otherwise). We all need to think for ourselves when it comes to trading our own accounts. First, it is the only way to really learn. Second, we are the only ones responsible for our decisions. Think of these charts as food for further analysis. Before making a trade, it is important to have a plan. Plan the trade and trade the plan. Among other things, this includes setting a trigger level, a target area and a stop-loss level. It is also important to plan for three possible price movements: advance, decline or sideways. Have a plan for all three scenarios BEFORE making the trade. Consider possible holding times. And finally, look at overall market conditions and sector/industry performance.


