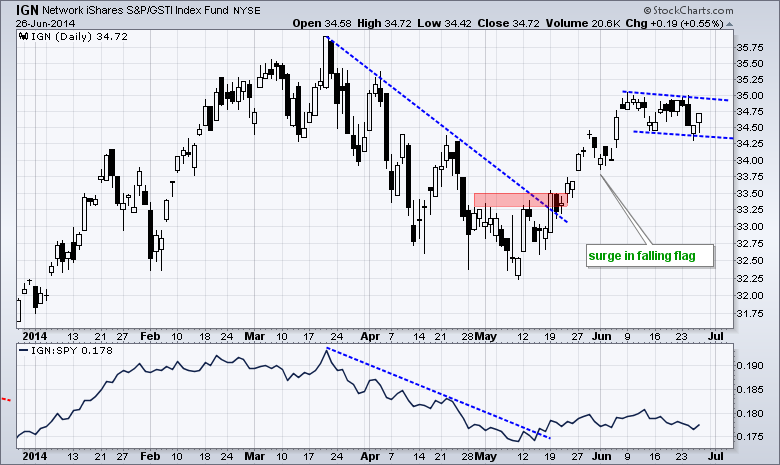
Stocks were mixed on Thursday with the Nasdaq 100 ETF edging higher (.05%) and the S&P 500 SPDR (SPY) edging lower (-.07%). Five sector SPDRs were up and four were down. Finance and consumer staples led the way lower with small losses. Utilities, healthcare and energy led the way higher with even smaller gains. There were some interesting splits yesterday. Within the technology sector, the Semiconductor SPDR fell .60%, but the Networking iShares gained .29%. The finance sector declined, but the Regional Bank SPDR edged higher with a .15% gain. Materials-related stocks showed some strength as the Copper Miners ETF, Steel ETF and Coal ETF gained on the day. The chart below shows the Networking iShares breaking out in mid May and surging above 34. A falling flag took shape the last three weeks and a break above flag resistance would signal a continuation higher. Failure to breakout and a move below 34.25 would be bearish.
**This chart analysis is for educational purposes only, and should not
be construed as a recommendation to buy, sell or sell-short said securities**
*************************************************************
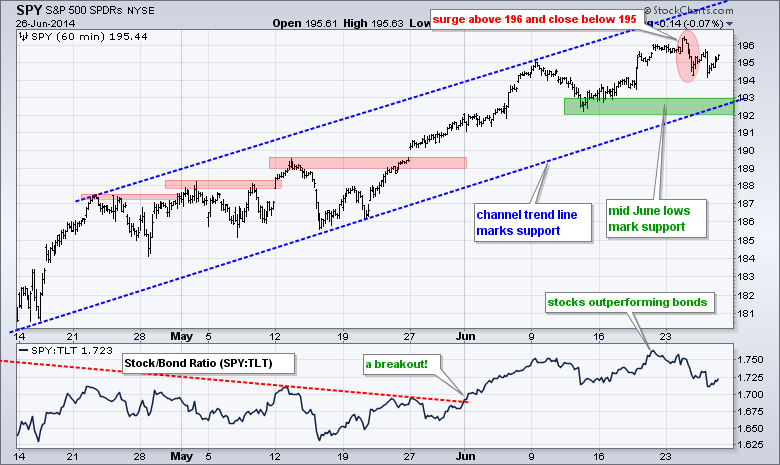
No change. SPY moved above 196 in early trading on Tuesday, but quickly reversed and closed below 195. An outside day formed on the daily chart and this could signal overhead resistance in the 196 area. Nevertheless, the short-term trend remains up with the rising channel defining this advance. The lower trend line and mid June low combine to mark key support in the 192-193 area. Trading may turn choppy between 193 and 196, but the upward bias remains as long as key support holds.
**************************************************************
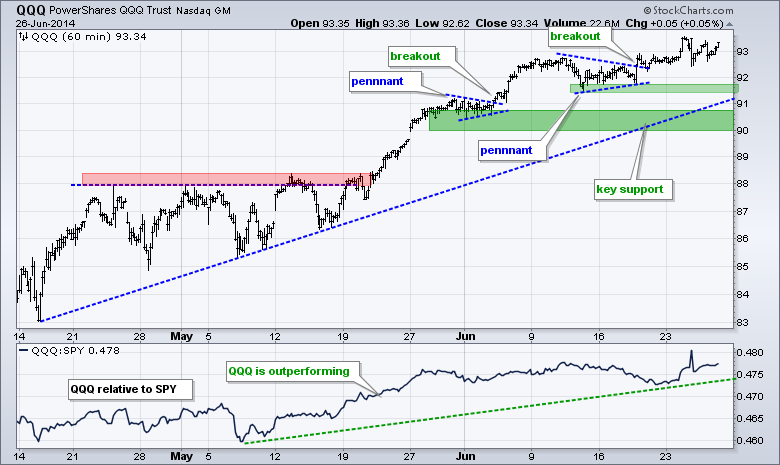
No change. QQQ surged above 93.5 on Tuesday and then fell to close at 92.70. It was an intraday reversal, but the move was not enough to negate the pennant breakout or even challenge the first support level. In fact, the ETF bounced on Wednesday with a move back above 93. The pennant lows mark first support at 91.50. The early June pennant, mid April trend line and a buffer mark key support in the 90-91 area.
**************************************************************
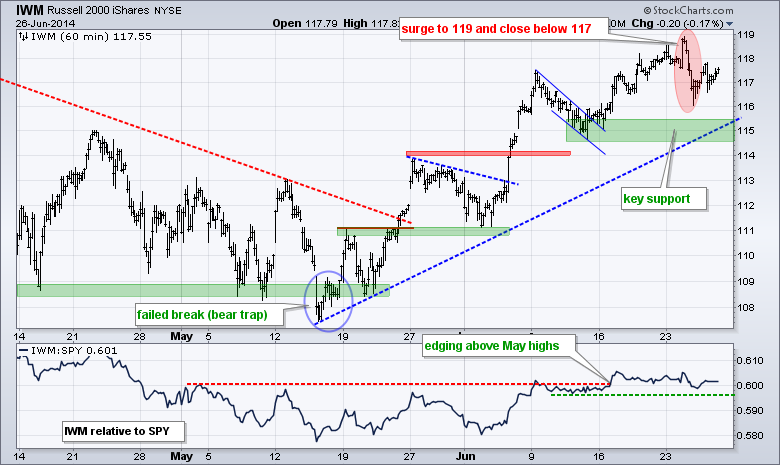
No change. IWM formed an even bigger intraday reversal on Tuesday as it surged to 119 and closed below 117. The move looks drastic for one day, but the overall trend remains up and the ETF managed to bounce on Wednesday. I am raising key support to the 115 area. The mid June lows and mid May trend line combine to mark key support here.
**************************************************************
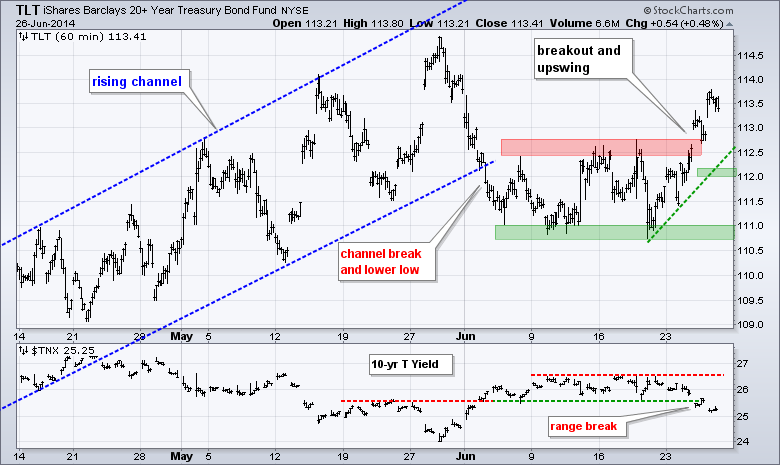
No change. A weak GDP report put a bid into bonds as TLT surged above its mid June highs and the 10-YR Treasury Yield ($TNX) broke its mid June lows. Thursday's PCE report showed tame inflation and TLT built on its breakout. The breakout is positive and extends the upswing. I am marking upswing support at 112. The June lows mark key support for TLT and the June highs mark key resistance for $TNX.
**************************************************************
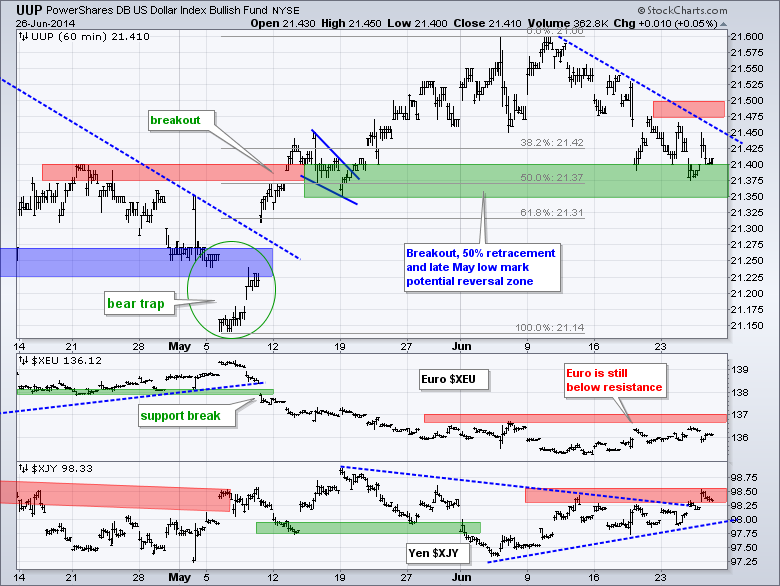
No change. The US Dollar ETF (UUP) fell over the last two weeks and the immediate trend is down. This still looks like a correction after the breakout-surge in May. The breakout zone, 50% retracement and late May low combine to mark a potential reversal zone in the 21.35-21.40 area. The Euro Index ($XEU) is still below resistance at 137, a break of which would be Euro bullish and Dollar bearish.
**************************************************************
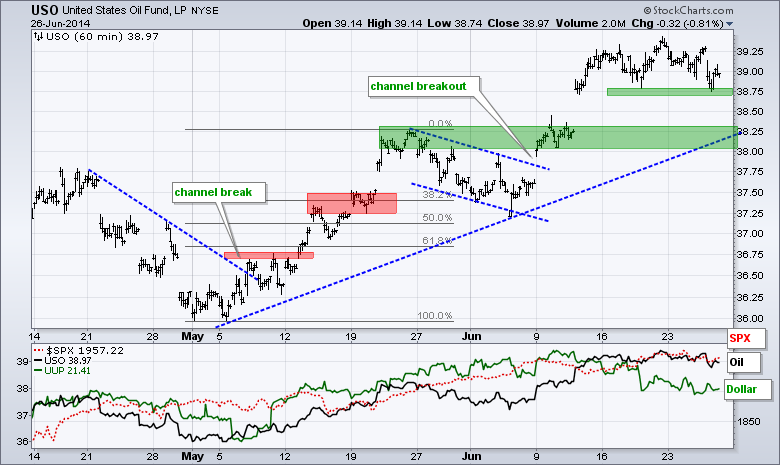
No change. The USO Oil Fund (USO) broke out in early June and surged above 39. The situation in Iraq is likely to remain unstable for a while and this will most affect Iraqi production. This could put a floor on oil prices and limit declines. Last week's low mark first support in the 38.75 area. Broken resistance and the May trend line mark key support in the 38-38.25 area.
**************************************************************
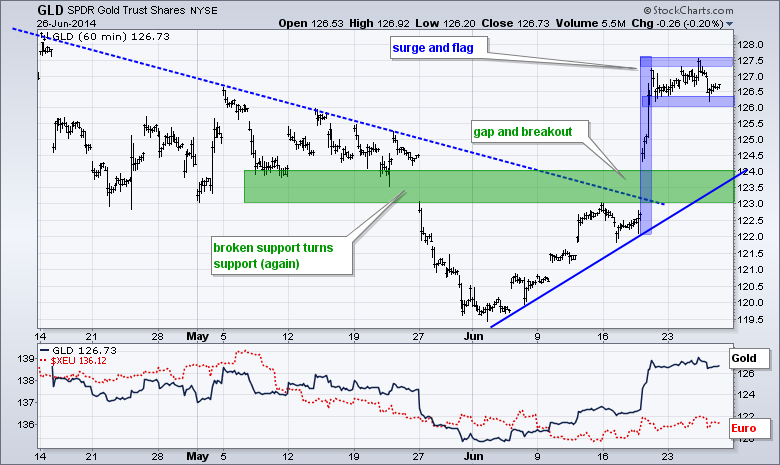
No change. The Gold SPDR (GLD) blew through this resistance zone with a gap and surge above 126. On the daily chart, GLD held above its December low and broke wedge resistance to signal a continuation of the surge from late December to mid March. GLD is obviously overbought right now and the broken resistance zone turns first support in the 123-124 area.
***************************************************************
Key Reports and Events (all times Eastern):
Fri - Jun 27 - 09:55 - Michigan Sentiment
This commentary and charts-of-interest are designed to stimulate thinking. This analysis is not a recommendation to buy, sell, hold or sell short any security (stock ETF or otherwise). We all need to think for ourselves when it comes to trading our own accounts. First, it is the only way to really learn. Second, we are the only ones responsible for our decisions. Think of these charts as food for further analysis. Before making a trade, it is important to have a plan. Plan the trade and trade the plan. Among other things, this includes setting a trigger level, a target area and a stop-loss level. It is also important to plan for three possible price movements: advance, decline or sideways. Have a plan for all three scenarios BEFORE making the trade. Consider possible holding times. And finally, look at overall market conditions and sector/industry performance.


