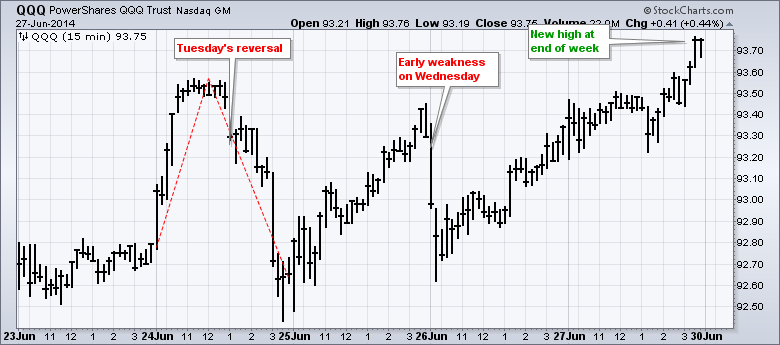
Stocks were hit with bouts of selling pressure on Tuesday afternoon and Thursday morning, but finished the week on a strong note. Overall, the major index ETFs were mixed for the week. QQQ gained 1.06%, SPY was down .06% and IWM rose .08%. The sectors were also mixed with four up and five down. The consumer discretionary sector gained 1.04% to lead. The industrials and consumer staples sectors lost over 1% each to lead on the way down. Despite weakness in the finance and industrials sectors, I was impressed with strength in homebuilders as the Home Construction iShares (ITB) added over 2% for the week.
Overall, the short-term trends for QQQ, IWM and SPY remain up. QQQ and SPY hit new highs last week, and IWM recovered from Tuesday's reversal to close above 118. It is a short week because the market is closed on Friday for the 4th of July. The economic docket is quite full with Pending Home Sales on Monday, ISM Manufacturing and Auto/Truck sales on Tuesday, ADP Employment on Wednesday and the employment report on Thursday. We also get ISM Services on Thursday. Trading volume could be light and this means market moves may be exaggerated when the data hits.
**This chart analysis is for educational purposes only, and should not
be construed as a recommendation to buy, sell or sell-short said securities**
*************************************************************
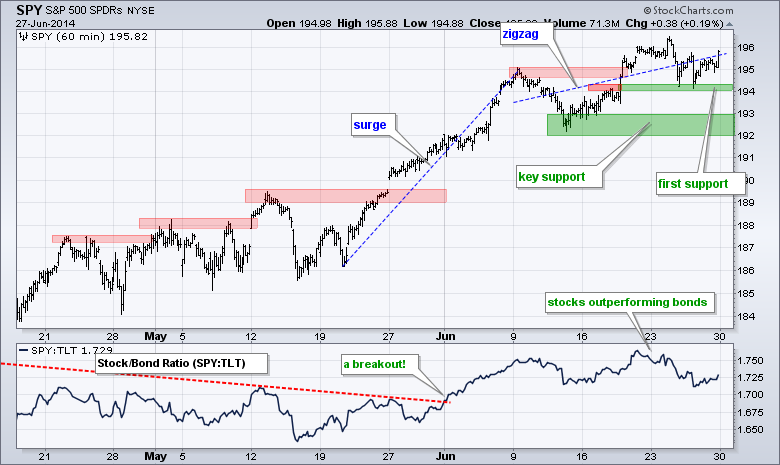
The short-term trend for SPY remains up, but the advance slowed a little as trading turned choppy the last three weeks. Notice how SPY surged from late May to early June. There was a correction the second week of June and the ETF then moved to a new high last week (above 196). The advance may be slowing, but it is still an advance. Last week's lows mark first support in the 194 area. The mid June lows mark key support in the 192-193 area.
**************************************************************
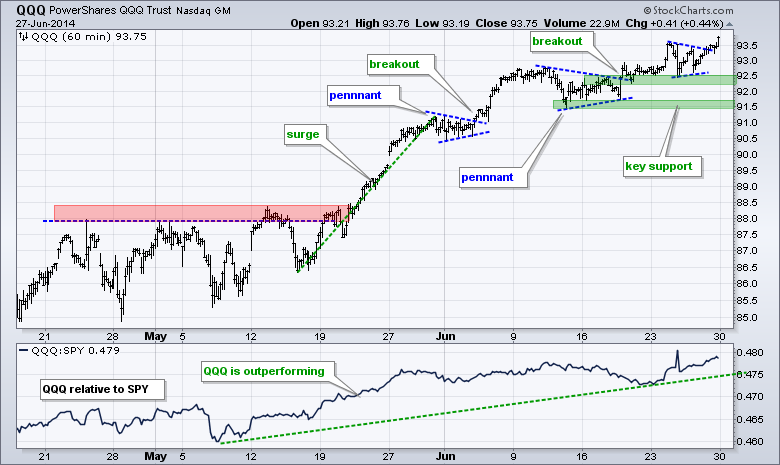
QQQ surged at the end of May and extended its advance in June with a choppier pattern. Three pennants formed and QQQ broke out three times. The most recent breakout occurred on Friday as the ETF finished at a new high. Broken resistance and last week's lows combine to mark first support in the 92.5 area. The mid June lows mark key support in the 91.50 area.
**************************************************************
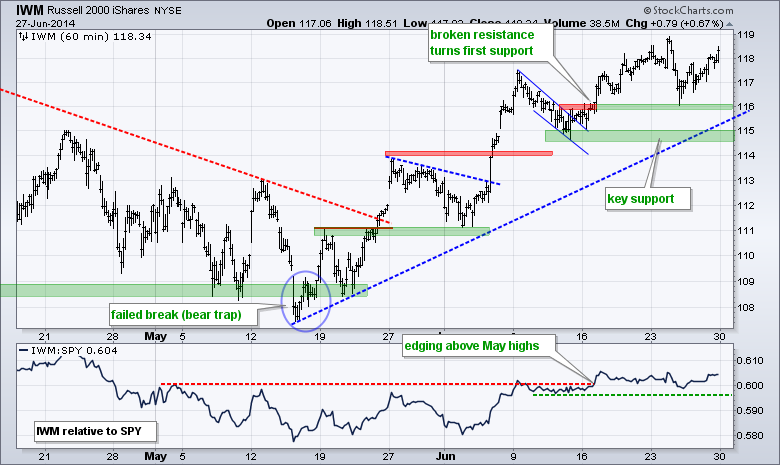
IWM remains in a short-term uptrend and hit a new high near 119 early last week. Even though the ETF reversed after this new high, the flag breakout turned into support and held near 116. This is now the first level to watch for signs of weakness. I will set key support in the 114.5-115 area. A break below this zone would fully reverse the short-term uptrend.
**************************************************************
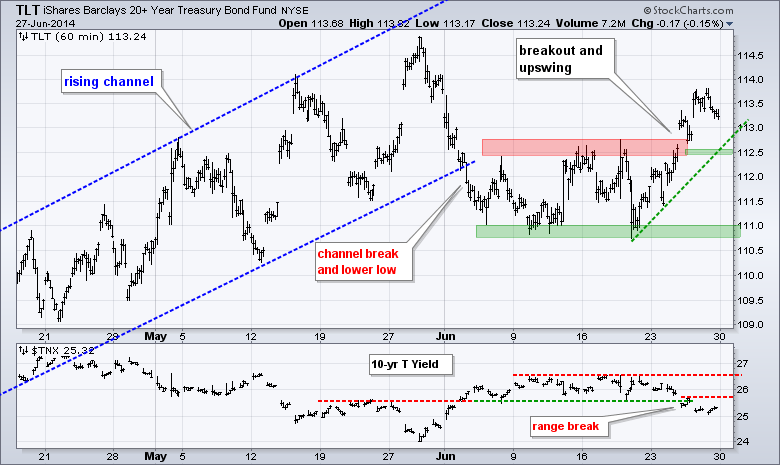
TLT held support in the 111 area and then surged above resistance to reverse the short-term downtrend. Broken resistance turns first support at 112.5, and this level also marks upswing support. A quick move below 112.5 would negate this breakout. The June lows mark key support in the 110.7-111 area. The 10-YR Treasury Yield ($TNX) broke support last week to confirm the upside breakout in TLT.
**************************************************************
The US Dollar ETF (UUP) remains in an immediate downtrend, but this three week decline could be a correction after the May surge. The decline has now retraced 50-62% of the prior advance and this zone may offer support. The downswing, however, remains in play as long as key support holds in the 21.45-21.475 area. A break out here would be bullish for UUP. The Euro Index ($XEU) is nearing resistance in the 137 area for a significant test. A breakout would be Euro bullish and Dollar bearish.

**************************************************************
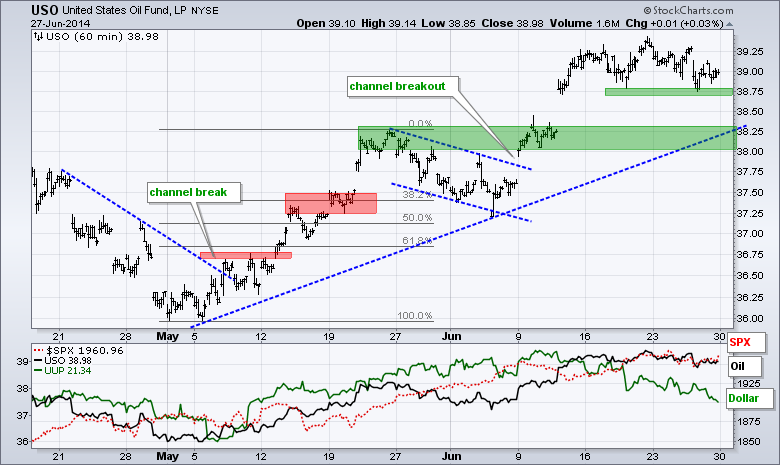
USO broke out in early June and surged above 39. The situation in Iraq is likely to remain unstable for a while and this will most likely affect Iraqi production, which could put a floor on oil prices and limit declines. Last week's low marks first support in the 38.75 area. Broken resistance and the May trend line mark key support in the 38-38.25 area.
**************************************************************
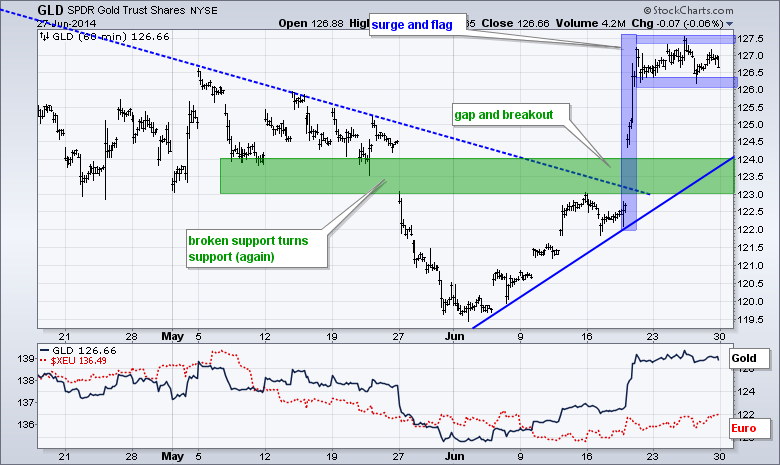
GLD surged above 124 and broke resistance with a big move in mid June. The ETF has since consolidated with a flat flag the last two weeks. A break above flag resistance would signal a continuation higher. Failure to break out and a move below flag support would argue for a move towards the big support zone in the 123-124 area.
***************************************************************
Key Reports and Events (all times Eastern):
Mon - Jun 30 - 09:45 - Chicago PMI
Mon - Jun 30 - 10:00 - Pending Home Sales
Tue - Jul 01 - 10:00 - ISM Manufacturing Index
Tue - Jul 01 - 10:00 - Construction Spending
Tue - Jul 01 - 14:00 - Auto Sales/Truck Sales
Wed - Jul 02 - 07:00 - MBA Mortgage Index
Wed - Jul 02 - 07:30 - Challenger Job Report
Wed - Jul 02 - 08:15 - ADP Employment Report
Wed - Jul 02 - 10:00 - Factory Orders
Wed - Jul 02 - 10:30 - Crude Oil Inventories
Thu - Jul 03 - 08:30 - Employment Report
Thu - Jul 03 - 10:00 - ISM Services Index
Thu - Jul 03 - 10:30 - Natural Gas Inventories
This commentary and charts-of-interest are designed to stimulate thinking. This analysis is not a recommendation to buy, sell, hold or sell short any security (stock ETF or otherwise). We all need to think for ourselves when it comes to trading our own accounts. First, it is the only way to really learn. Second, we are the only ones responsible for our decisions. Think of these charts as food for further analysis. Before making a trade, it is important to have a plan. Plan the trade and trade the plan. Among other things, this includes setting a trigger level, a target area and a stop-loss level. It is also important to plan for three possible price movements: advance, decline or sideways. Have a plan for all three scenarios BEFORE making the trade. Consider possible holding times. And finally, look at overall market conditions and sector/industry performance.


