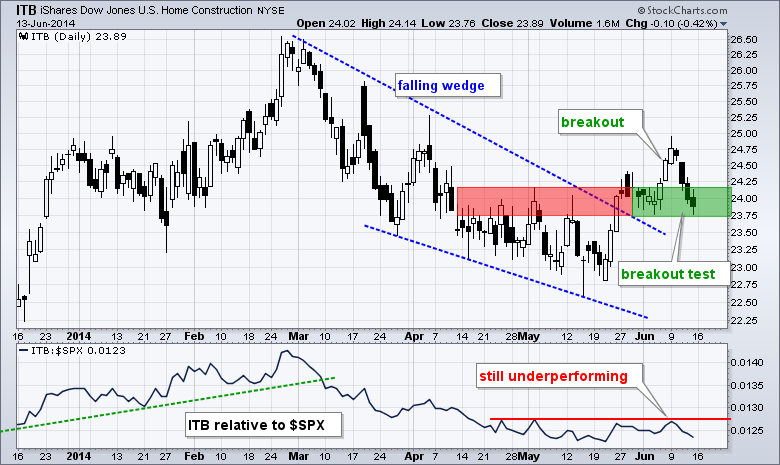
It could be a big week for housing-related stocks and Treasury bonds. The Home Construction iShares (ITB) is at a critical juncture because it is testing the early June breakout after last week's pullback. We will get new data points for housing starts and building permits on Tuesday. These numbers could provide the make-or-break catalyst for ITB. Positive numbers could spur buying pressure and keep the breakout in ITB alive. Negative numbers could trigger selling pressure and negate the breakout.
**This chart analysis is for educational purposes only, and should not
be construed as a recommendation to buy, sell or sell-short said securities**
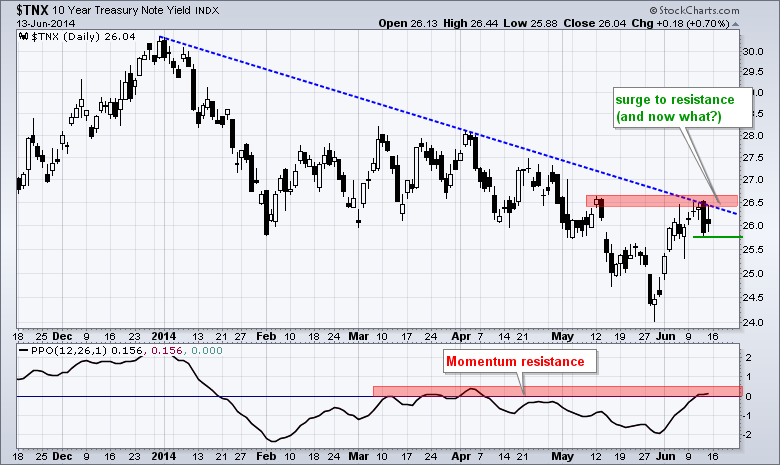
The 10-YR Treasury Yield ($TNX) surged in early June and then stalled at a key level with choppy trading last week. The Fed makes its policy statement on Wednesday at 2PM and Treasuries will hang on every nuance. The 10-YR Treasury Yield ($TNX) surged to resistance and then formed a long black candlestick with an outside reversal on Thursday. Buying pressure in Treasuries pushed yields lower on Thursday as Treasuries attracted safe-haven money because oil surged on Iraq worries. $TNX remains at a make-or-break level. A surge above the resistance zone would signal higher yields and this would be bearish for Treasury bonds. A failure at resistance and break below Thursday's low would keep the downtrend in $TNX alive.
**************************************************************
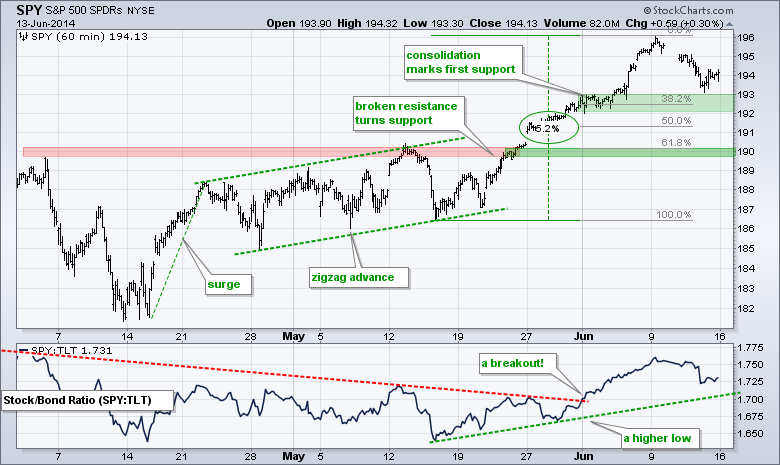
SPY remains in an uptrend since the April surge above 187. After a 5% advance the last three weeks, SPY corrected last week with a decline to the 193-194 area, which is just above the first support zone. I am marking first support in the 192-193 area (38% retracement and early June consolidation. Further down, broken resistance and the 61% retracement mark support in the 190 area. If I had to make a guess, I would guess that this correction will end and we could see a reversal in the 191 area (between the two support zones).
**************************************************************
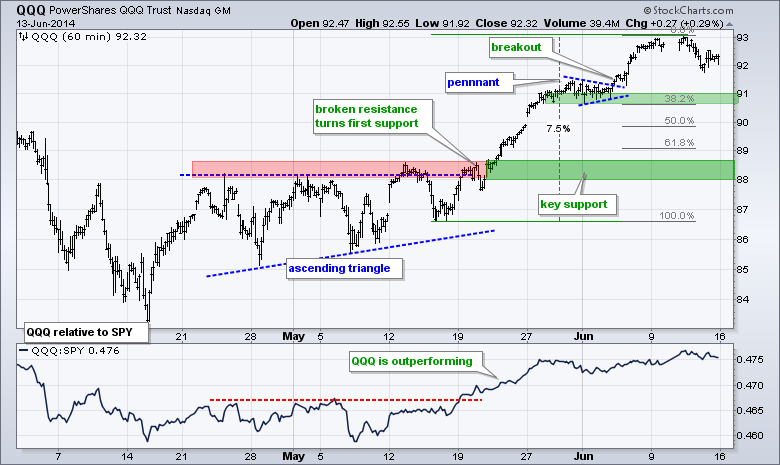
QQQ surged over 7% with the move to 93 and then fell back to 92 last week. This is not much of a correction or pullback. QQQ remains the strongest of the big three (IWM, SPY, QQQ) because it has the shallowest pullback. The pennant lows and 38% retracement combine to mark first support in the 91 area. I will leave key support in the 88-88.5 area for now.
**************************************************************
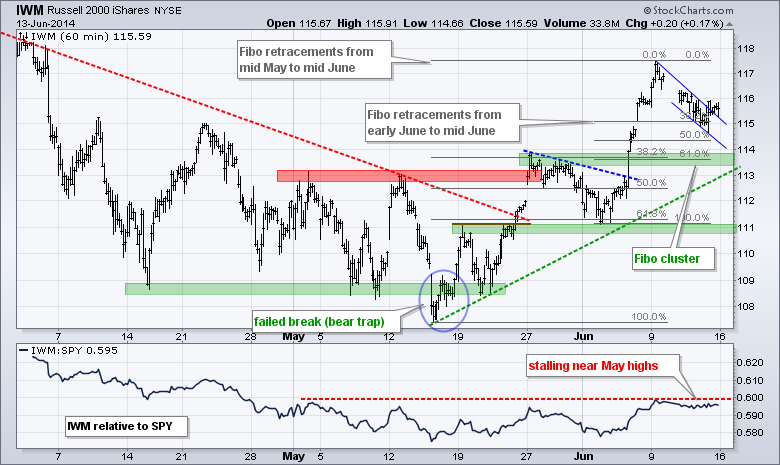
IWM surged over 5% in early June and over 9% from its mid May low to its mid June high. The ETF was overbought above 117 and corrected last week with a decline to the 115-116 area. I drew a falling flag with the blue trend lines and the ETF broke the upper trend line on Friday. I am not sure, however, if this breakout is going to hold because the flag was quite tight. We may see further correction towards the 113-114 area. I drew Fibonacci retracements from the mid May low to the mid June high and from the early June low to the mid June high. A cluster formed in the 113-114 area and there is support from broken resistance here. I would look for a reversal in this area.
**************************************************************
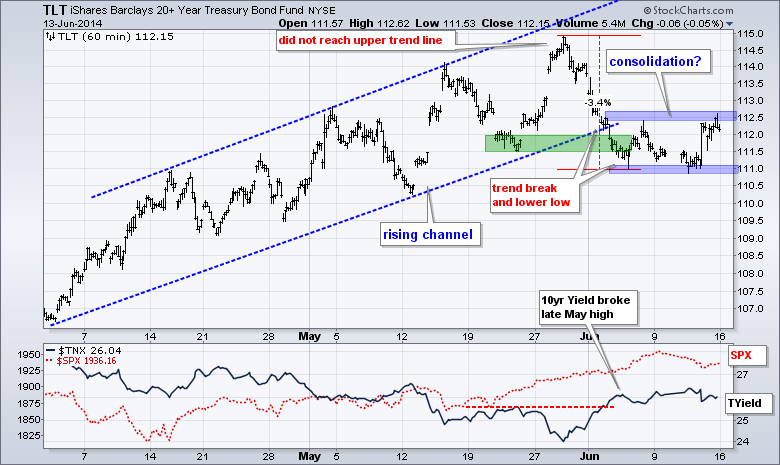
TLT broke down with a move to 111 in early June and then moved into a rather choppy range. At this point, I think we need to establish a directional bias: up or down. I have a downward bias on TLT because of the channel break and lower low in early June. This means the choppy range is a correction within a bigger downtrend. This thesis would be seriously tested with a break above 112.7. A break below the consolidation lows would signal a continuation lower.
**************************************************************
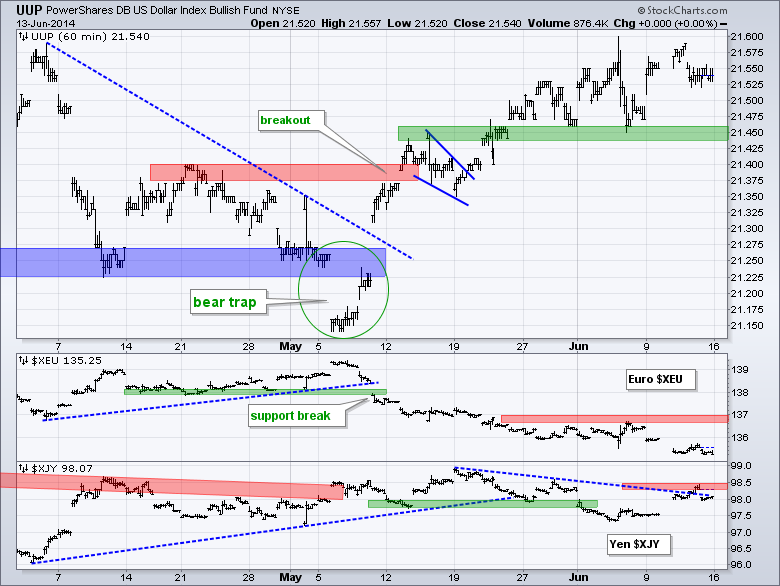
The US Dollar ETF (UUP) got another bounce as the Euro Index ($XEU) sank below 135.5 last week. UUP held its breakout as broken resistance turned support in the 21.45 area. This is the first support zone to watch for a break down. I am lowering key resistance for the Euro to 137. In the lower indicator window, the Yen Index ($XJY) bounced above 98 and is on the verge of breaking a four week trend line. Strength in the Yen would be negative for the Nikkei 225 ($NIKK).
**************************************************************
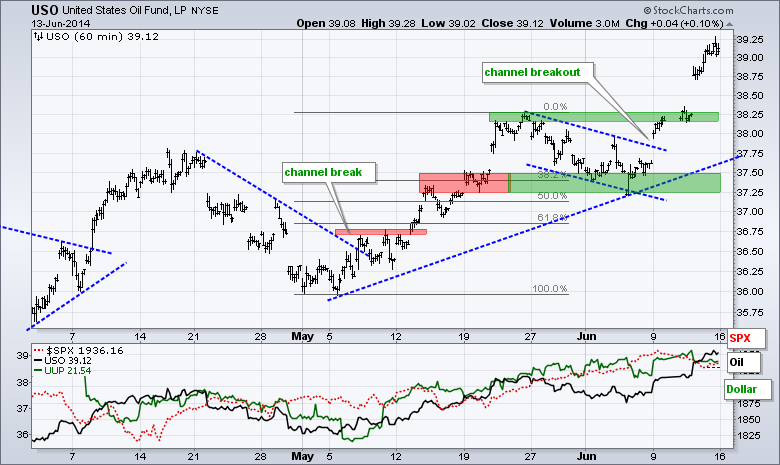
USO continued higher with a surge above 39 and Spot Light Crude ($WTIC) broke above a key resistance zone on the daily chart. Broken resistance in the 38.25 area turns first support for USO. I will leave key support in the 37.25-37.5 area for now.
**************************************************************
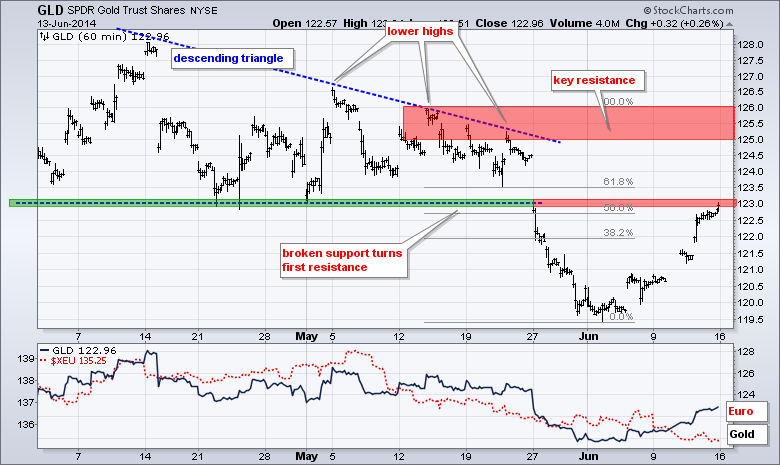
Gold got a big bounce last week as worries on Iraq pushed money into this safe haven. There was probably some short covering as well. Gold, however, remains in a medium-term and long-term downtrend. Last week's surge may be enough to reverse the short-term downtrend, but resistance is at hand from broken support and the 50-62% retracement zone.
***************************************************************
Key Reports and Events (all times Eastern):
Mon - Jun 16 - 08:30 - Empire State Manufacturing
Mon - Jun 16 - 09:15 - Industrial Production
Mon - Jun 16 - 10:00 - NAHB Housing Market Index
Tue - Jun 17 - 08:30 - Housing Starts/Building Permits
Tue - Jun 17 - 08:30 - Consumer Price Index (CPI)
Wed - Jun 18 - 07:00 - MBA Mortgage Index
Wed - Jun 18 - 10:30 - Crude Oil Inventories
Wed - Jun 18 - 14:00 - FOMC Policy Statement
Thu - Jun 19 - 08:30 - Initial Jobless Claims
Thu - Jun 19 - 10:00 - Philadelphia Fed Report
Thu - Jun 19 - 10:00 - Leading Economic Indicators
Thu - Jun 19 - 10:30 - Natural Gas Inventories
Fri - Jun 20 - 10:30 - Happy Friday!
This commentary and charts-of-interest are designed to stimulate thinking. This analysis is not a recommendation to buy, sell, hold or sell short any security (stock ETF or otherwise). We all need to think for ourselves when it comes to trading our own accounts. First, it is the only way to really learn. Second, we are the only ones responsible for our decisions. Think of these charts as food for further analysis. Before making a trade, it is important to have a plan. Plan the trade and trade the plan. Among other things, this includes setting a trigger level, a target area and a stop-loss level. It is also important to plan for three possible price movements: advance, decline or sideways. Have a plan for all three scenarios BEFORE making the trade. Consider possible holding times. And finally, look at overall market conditions and sector/industry performance.


