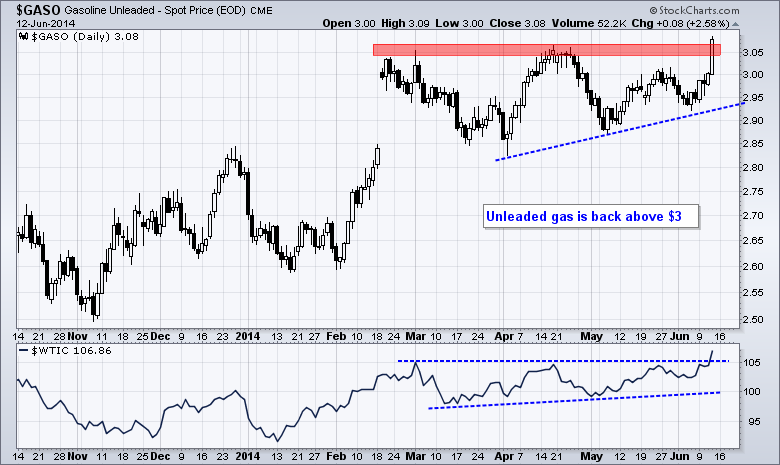
Selling pressure extended on Thursday, but the losses in the major index ETFs were modest. The Russell 2000 ETF declined .61% and the S&P 500 SPDR fell .71%. This is moderate selling pressure. There were, of course, some pockets with more intense selling pressure. The consumer discretionary and industrials sectors fell over 1%. Weakness in home construction and retail weighed on the consumer discretionary sector. The Dow Transports fell around 2% and weakness in this group weighed on the industrials sector. Energy shares bucked the selling pressure as Spot Light Crude surged above a key resistance level. The Oil & Gas E&P SPDR led the way with a 1.33% gain. The chart below shows Unleaded Gasoline ($GASO) breaking above its March-April highs and moving above $3.05 per gallon.
**This chart analysis is for educational purposes only, and should not
be construed as a recommendation to buy, sell or sell-short said securities**
*************************************************************
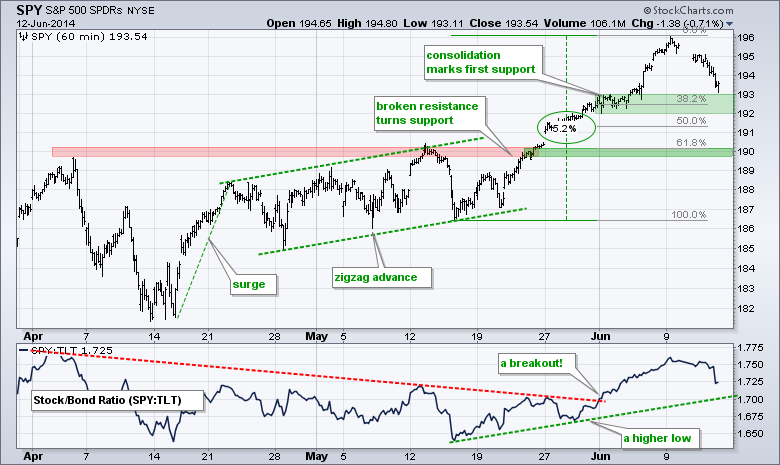
SPY surged over 5% with a move to 196 and then declined to the 193.5 area this week. The first support zone is coming into play in the 192-193 area. Also notice that the 38% retracement resides in the 192.5 area. Further down, broken resistance turns into support in the 190 area and this level is confirmed by the 62% retracement line.
**************************************************************
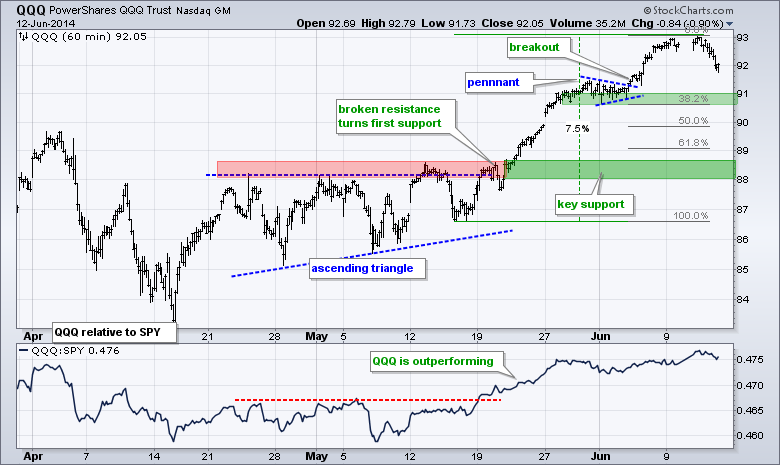
QQQ surged over 7% with the move to 93 and then fell back to 92 this week. This hardly counts as a correction or pullback. QQQ remains the strongest of the big three (IWM, SPY, QQQ) because it has the shallowest pullback. The pennant lows and 38% retracement combine to mark first support in the 91 area. I will leave key support in the 88-88.5 area for now.
**************************************************************
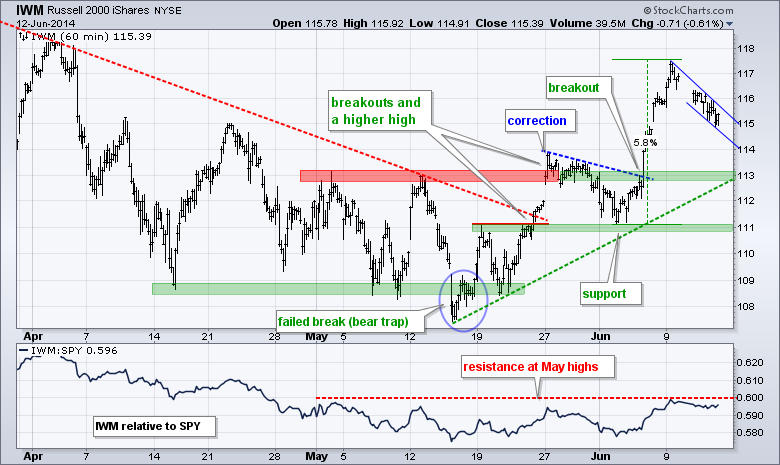
IWM fell back this week with a falling flag pattern taking shape. The breakout and surge to 117 clearly reversed the medium-term downtrend. The ETF was overbought after a 5.8% surge and was entitled to a corrective period. A move above 116.1 would break flag resistance and signal a resumption of the prior advance. Barring a breakout, the next support zone is around 113. The price relative (IWM:SPY ratio) is stalling near the May highs and a breakout would signal a return to relative strength for IWM.
**************************************************************
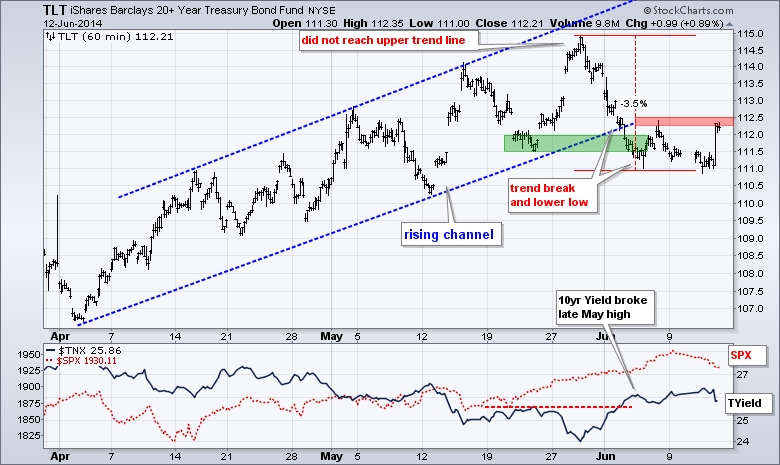
TLT surged to its resistance zone with a sharp advance on Thursday. The turmoil in Iraq probably put a bid into Treasuries because they are viewed as a safe haven. I still think the overall trend is down for TLT and up for the 10-YR Treasury Yield ($TNX). TLT is, therefore, at an important level. A follow through breakout at 112.5 would be positive and we could then see a bigger retracement of the prior decline.
**************************************************************
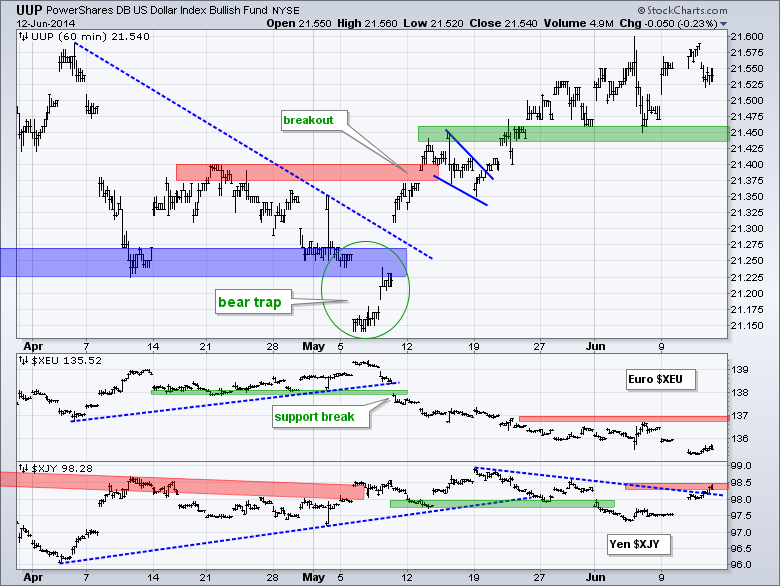
No change. The US Dollar ETF (UUP) got another bounce as the Euro Index ($XEU) sank below 135.5 on Thursday. UUP held its breakout as broken resistance turned support in the 21.45 area. This is the first support zone to watch for a break down. I am lowering key resistance for the Euro to 137. In the lower indicator window, the Yen Index ($XJY) bounced above 98 and is on the verge of breaking a four week trend line. Strength in the Yen would be negative for the Nikkei 225 ($NIKK).
**************************************************************
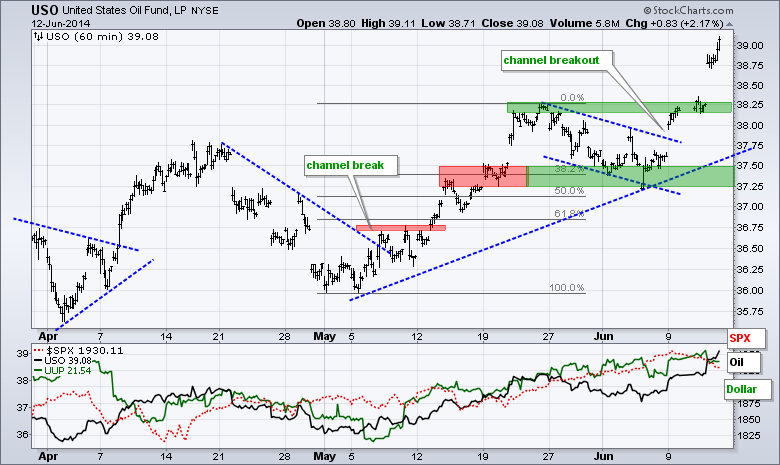
USO continued higher with a surge above 39 and Spot Light Crude ($WTIC) broke above a key resistance zone on the daily chart. Broken resistance in the 38.25 area turns first support for USO. I will leave key support in the 37.25-37.5 area for now.
**************************************************************
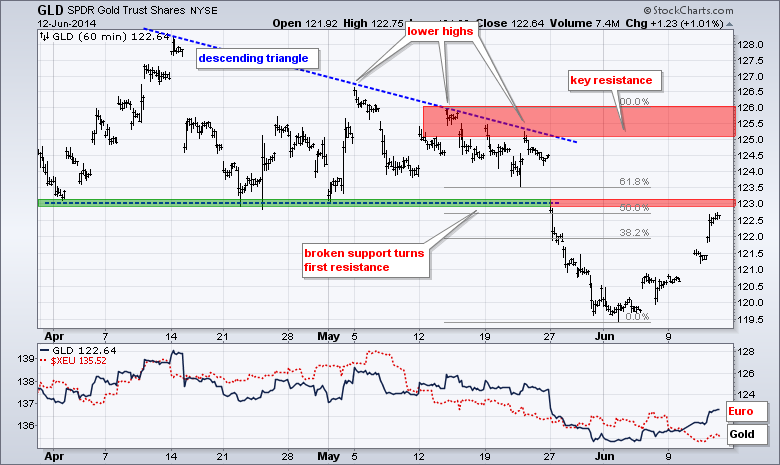
Gold got a big bounce this week as worries on Iraq pushed money into this safe haven. There was probably some short covering as well. Gold remains in a medium-term and long-term downtrend. This week's surge may be enough to reverse the short-term downtrend, but resistance is close at hand from broken support and the 50-62% retracement zone.
***************************************************************
Key Reports and Events (all times Eastern):
Fri - Jun 13 - 08:30 - Producer Price Index (PPI)
Fri - Jun 13 - 09:55 - Michigan Sentiment
This commentary and charts-of-interest are designed to stimulate thinking. This analysis is not a recommendation to buy, sell, hold or sell short any security (stock ETF or otherwise). We all need to think for ourselves when it comes to trading our own accounts. First, it is the only way to really learn. Second, we are the only ones responsible for our decisions. Think of these charts as food for further analysis. Before making a trade, it is important to have a plan. Plan the trade and trade the plan. Among other things, this includes setting a trigger level, a target area and a stop-loss level. It is also important to plan for three possible price movements: advance, decline or sideways. Have a plan for all three scenarios BEFORE making the trade. Consider possible holding times. And finally, look at overall market conditions and sector/industry performance.


