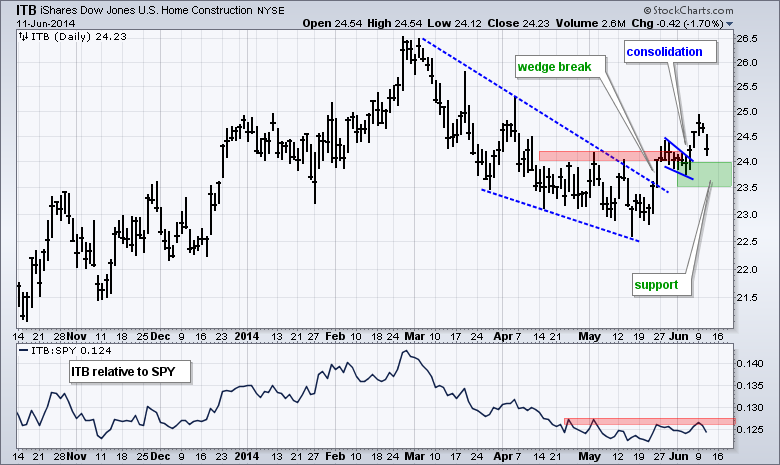
Stocks came under selling pressure on Wednesday with the Russell 2000 ETF losing around .50% and the S&P 500 SPDR falling .35%. Even though today's decline was insignificant for the broader market, there are some growing concerns that could lead to a pullback or corrective period for stocks. First, SPY is up over 7% since mid April. Second, Spot Light Crude ($WTIC) is pushing against resistance at 105 as conditions in Iraq deteriorate. Third, sentiment is quite bullish as Investors Intelligence net bulls surged above 40%. Also note that there were some market pockets with more intense selling pressure. The Utilities SPDR fell over 1% as the 10-YR Treasury Yield continued to edge higher. The Regional Bank SPDR and Broker-Dealer iShares fell over 1%. Semis bucked the selling pressure as the Semiconductor SPDR surged 1.52% and hit another new high. The Home Construction iShares was weak and suffered a 1.70% decline. The chart below shows ITB breaking out with a surge above 24.5 and then falling back on Wednesday. Last week's low and the wedge breakout mark first support, which needs to hold to keep the breakout alive.
**This chart analysis is for educational purposes only, and should not
be construed as a recommendation to buy, sell or sell-short said securities**
*************************************************************
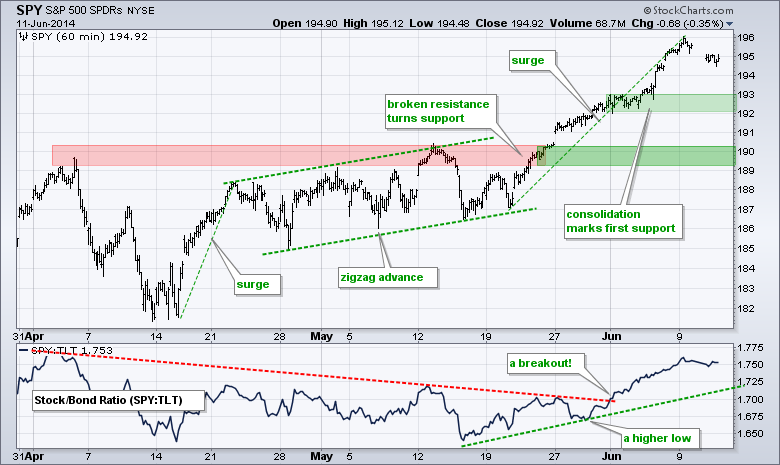
No change. SPY remains in a clear uptrend, but surged over 4% in three weeks. The ETF is getting a little overbought and this could bring about a corrective period, which could entail a trading range or a pullback. The consolidation from early last week marks first support in the 192-193 area. Broken resistance turns into key support in the 189-190 area. The SPY:TLT ratio formed a higher low in late May and broke out in early June. This means stocks are outperforming bonds, which is positive for stocks.
**************************************************************
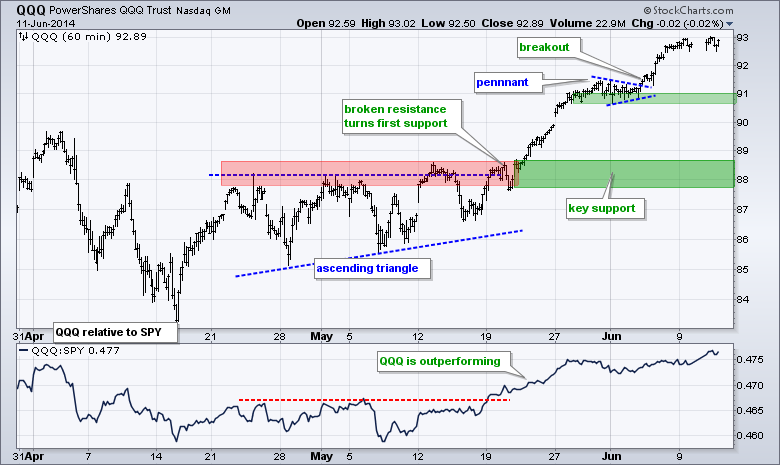
No change. QQQ broke pennant resistance and resumed its uptrend with a surge to new highs. The pennant lows now mark first support in the 90.7-91 area. Like SPY, QQQ is getting a little overbought after a 5+ percent advance in three weeks. These overbought conditions could give way to a corrective period or choppy trading in the days/weeks ahead. Key support remains in the 88 area for now.
**************************************************************
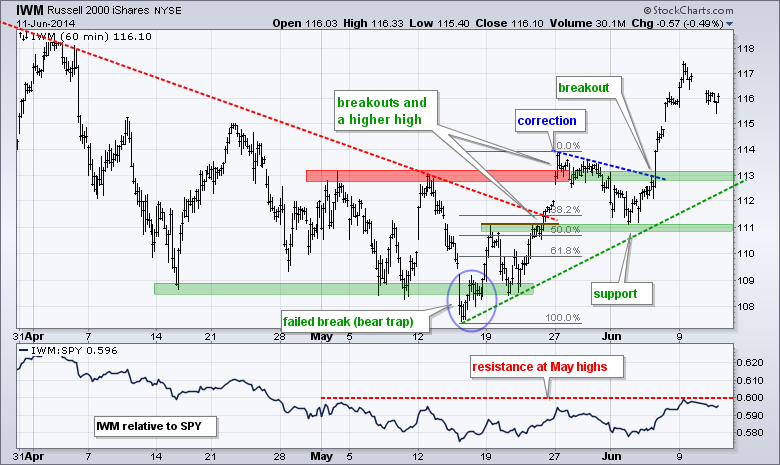
No change. IWM is not outperforming SPY yet, but the ETF got a breakout with its two-day surge to 116. Overall, IWM surged above 113 in mid May, pulled back with a correction to the 111 area and continued higher with last week's breakout. Last week's lows mark a support zone in the 111 area. Broken resistance turns first support in the 113 area. The indicator window shows the price relative (IWM:SPY ratio) flattening the last five weeks. A breakout would indicate relative strength in IWM.
**************************************************************
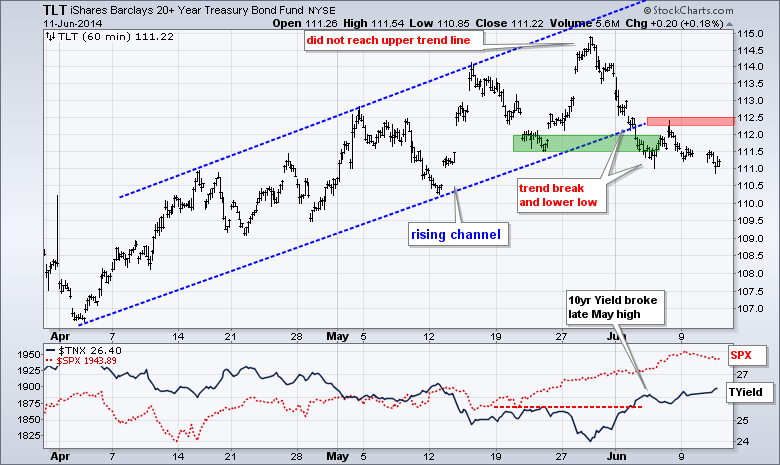
TLT broke the channel trend line and forged a lower low with last week's decline below 111.5. The ETF looked oversold and ripe for a bounce or consolidation, but continued lower the last four days. Money continues to move out of Treasuries and yields are moving higher. Last Thursday's high mark the first resistance zone to watch in the 112.50 area.
**************************************************************
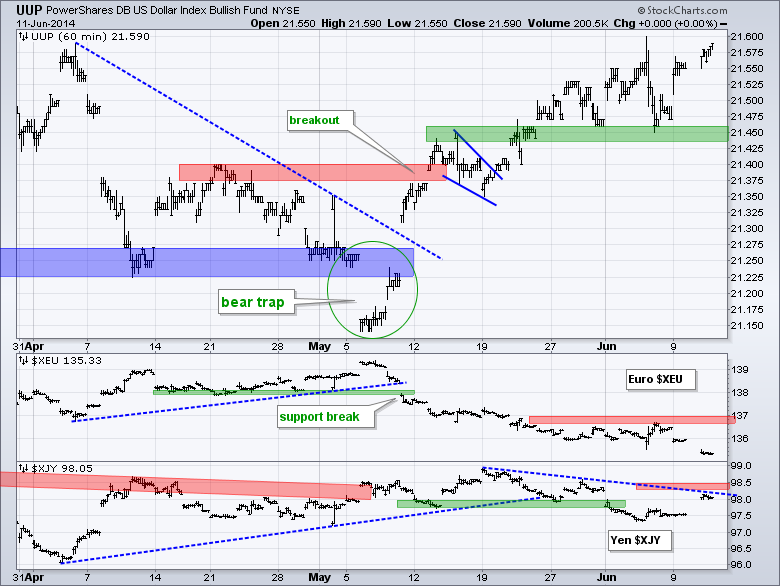
The US Dollar ETF (UUP) got another bounce as the Euro Index ($XEU) sank below 135.5 on Thursday. UUP held its breakout as broken resistance turned support in the 21.45 area. This is the first support zone to watch for a break down. I am lowering key resistance for the Euro to 137. In the lower indicator window, the Yen Index ($XJY) bounced above 98 and is on the verge of breaking a four week trend line. Strength in the Yen would be negative for the Nikkei 225 ($NIKK).
**************************************************************
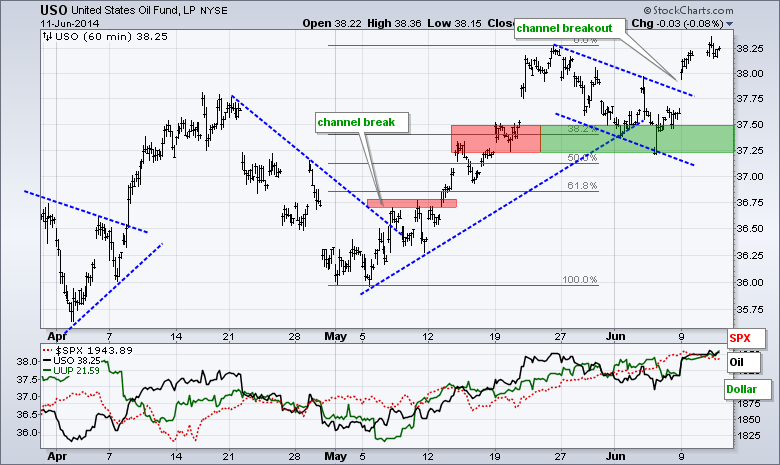
No change. USO ultimately held support in the 37.2-37.4 area and surged above channel resistance to signal a continuation of the bigger uptrend. This more reinforces support at 37.2.
**************************************************************
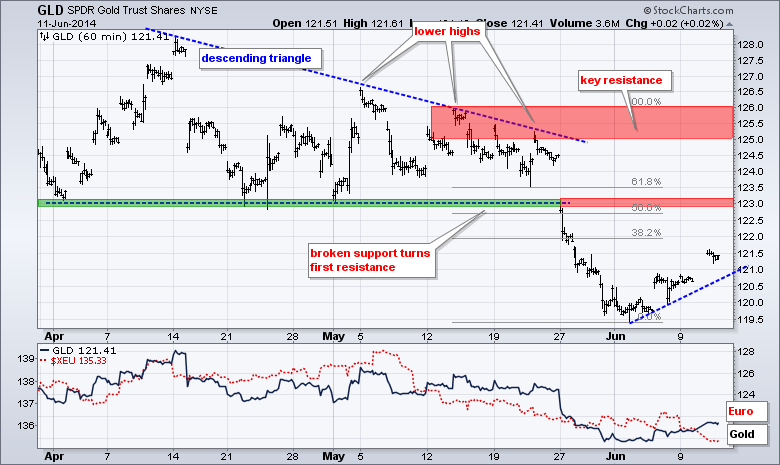
No change. Gold got a small bounce from oversold levels, but the overall trend remains down. This bounce could retrace a portion of the prior decline, which was from 126 to 119.5. Broken support turns first resistance in the 123 area. This area also marks the 50-62% retracement zone. I will leave key resistance in the 125-126 area for now.
***************************************************************
Key Reports and Events (all times Eastern):
Thu - Jun 12 - 08:30 - Initial Jobless Claims
Thu - Jun 12 - 08:30 - Retail Sales
Thu - Jun 12 - 10:00 - Business Inventories
Thu - Jun 12 - 10:30 - Natural Gas Inventories
Fri - Jun 13 - 08:30 - Producer Price Index (PPI)
Fri - Jun 13 - 09:55 - Michigan Sentiment
This commentary and charts-of-interest are designed to stimulate thinking. This analysis is not a recommendation to buy, sell, hold or sell short any security (stock ETF or otherwise). We all need to think for ourselves when it comes to trading our own accounts. First, it is the only way to really learn. Second, we are the only ones responsible for our decisions. Think of these charts as food for further analysis. Before making a trade, it is important to have a plan. Plan the trade and trade the plan. Among other things, this includes setting a trigger level, a target area and a stop-loss level. It is also important to plan for three possible price movements: advance, decline or sideways. Have a plan for all three scenarios BEFORE making the trade. Consider possible holding times. And finally, look at overall market conditions and sector/industry performance.


