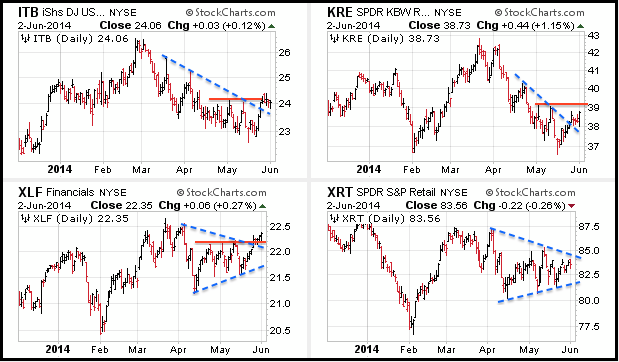
Stocks put in a mixed performance on Monday with large-caps and mid-caps edging higher, and small-caps moving lower. The gains and losses were contained and not enough to affect the short-term trends. Five of the nine sector SPDRs were up, but the gains and losses were inconsequential. Of note, the Regional Bank SPDR (KRE) caught a bid and surged over 1% as the 10-YR Treasury Yield ($TNX) moved back above 2.50%. The Copper Miners ETF (COPX) surged over 1% as copper extended its eleven week advance with a 1% gain. As noted in Monday's Market Message, I am focused on three groups for clues on the broader market. The CandleGlance chart below shows the Home Construction iShares (ITB) breaking the blue trend line and stalling near resistance. A break above 24.5 would be very bullish here. The Regional Bank SPDR (KRE) broke the blue trend line and a follow through break above 39.2 would be bullish. The Finance SPDR (XLF) broke triangle resistance with an advance the last two weeks. The Retail SPDR (XRT) is triangulating and a break above 85 would be bullish.
**This chart analysis is for educational purposes only, and should not
be construed as a recommendation to buy, sell or sell-short said securities**
*************************************************************
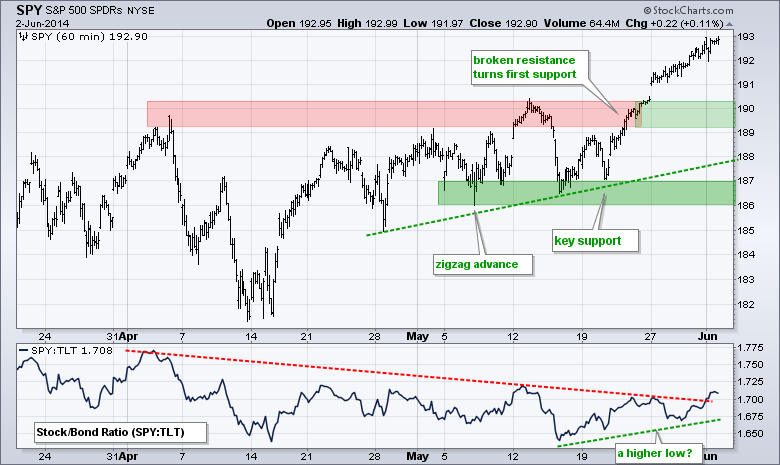
No change. SPY remains the little engine that could. The ETF surged in mid April, zigzagged higher from late April to mid May and then surged again in late May. SPY moved to new highs last week and is up around 3% over the last three weeks. Broken resistance in the 189-190 area turns first support to watch on a throwback. I will leave key support in the 186-187 area for now. The indicator window shows the SPY:TLT ratio attempting a higher low over the last few weeks. A breakout would be positive and signal that stocks are outperforming bonds.
**************************************************************
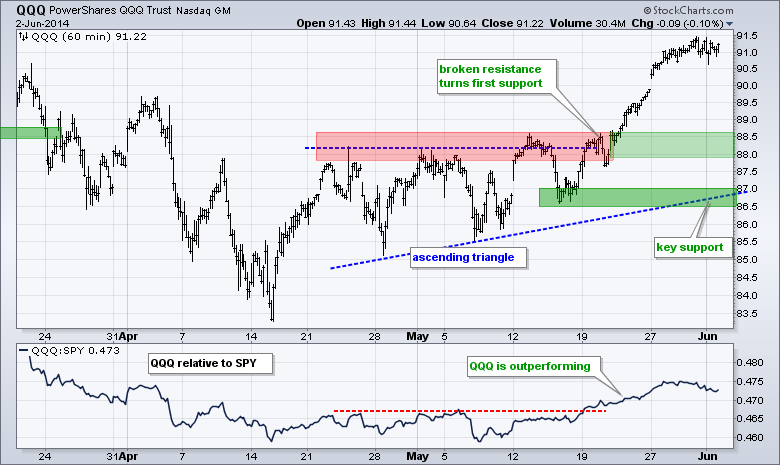
No change. QQQ surged in mid April, formed an ascending triangle (of sorts) from late April to mid May and broke to new highs over the last two weeks. The ETF is up over 5% in 3 weeks and getting frothy, but shows no signs of selling pressure. Broken resistance in the 88-88.5 area turns first support. I will leave key support in the 86.5-87 area for now. The indicator window shows the QQQ:SPY ratio breaking out two weeks ago as QQQ outperforms SPY.
**************************************************************
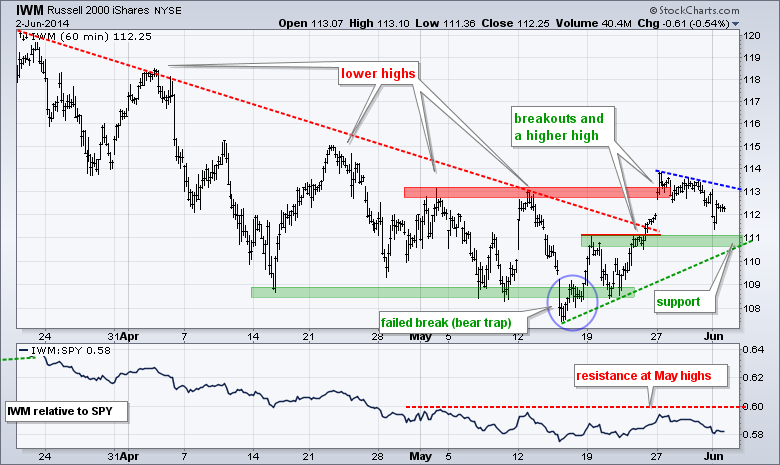
IWM fell sharply on the open with a move below 112, but recovered somewhat and closed back above 112. Resistance in the 113 area continues to exert its force as the ETF has yet to make a convincing breakout on the daily chart. Short-term, the decline over the last five days could be corrective and a break above 113.2 would signal an end to this correction. Broken resistance and the mid May trend line combine to mark first support in the 110.5-111 area. The IWM:SPY ratio fell back over the last five days as IWM resumed its relative weakness trend and I will set resistance as the May highs. A breakout here is needed to signal a return to relative strength for IWM.
**************************************************************
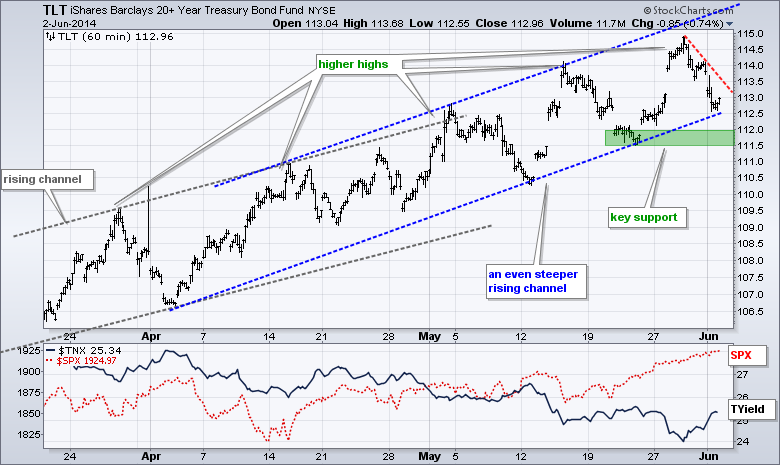
The 20+ YR T-Bond ETF (TLT) surged to a new high last week and then turned down with a rather sharp pullback the last three days (Thursday-Friday-Monday). Bonds may be getting nervous with so many economic reports on deck this week. Note that TLT did not make it back to the upper trend line of the rising channel. This is a minor miss for now, but does suggest that upside momentum is slowing. TLT is now testing the lower trend line and I am marking key support in the 111.5-112 area. A break here would reverse the two month uptrend.
**************************************************************
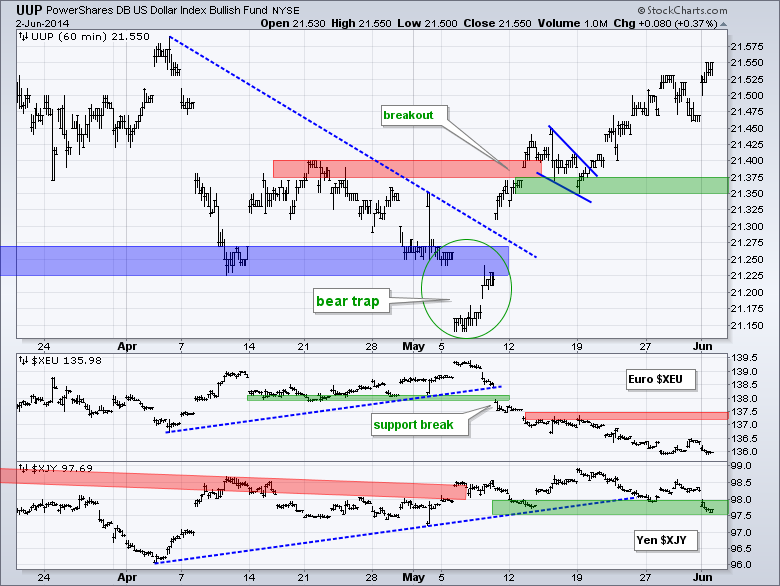
No change. The US Dollar ETF (UUP) remains in bull mode with a series of bullish signals the last four weeks. First, UUP failed to hold the support break in early May and produced a bear trap. Second, the ETF followed through with a break above resistance in mid May. Third, UUP formed a small wedge and broke out with a surge the last two weeks. The wedge lows mark key support in the 21.35-21.375 area. The Euro Index ($XEU) is in bear mode with resistance marked at 137.5.
**************************************************************
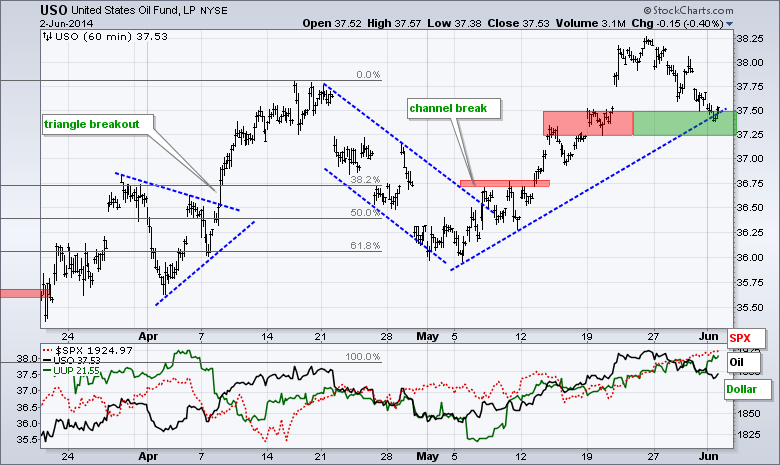
No change. The USO Oil Fund (USO) remains in an uptrend overall with a higher low in early May and a higher high in late May. The ETF fell back last week and is now testing support in the 37.25-37.50 area. Broken resistance and the early May trend line combine to mark support here.
**************************************************************
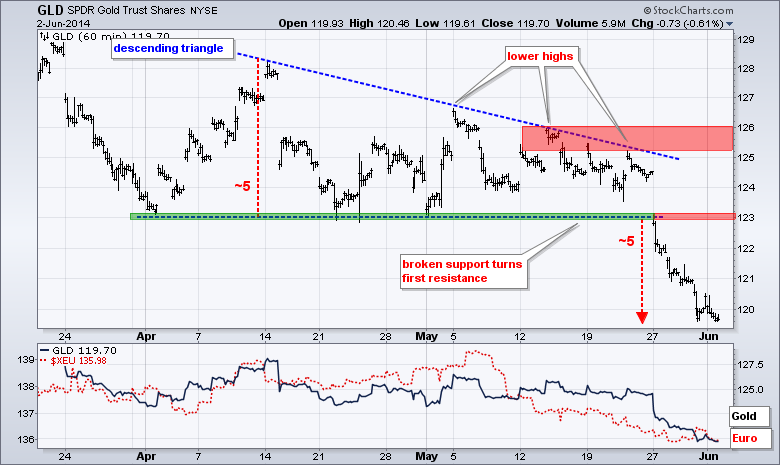
No change. Gold is in a long-term downtrend, medium-term downtrend and short-term downtrend. The Gold SPDR (GLD) formed a descending triangle over the prior eight weeks and broke support with a sharp decline last week. This signals a continuation of the downtrend and targets a move to the 118 area. The mid May highs mark key resistance in the 125-126 area. Broken support in the 123 area turns first resistance.
***************************************************************
Key Reports and Events (all times Eastern):
Tue - Jun 03 - 10:00 - Factory Orders
Tue - Jun 03 - 14:00 - Auto/Truck Sales
Wed - Jun 04 - 07:00 - MBA Mortgage Index
Wed - Jun 04 - 08:15 - ADP Employment Report
Wed - Jun 04 - 10:00 - ISM Services Index
Wed - Jun 04 - 10:30 - Crude Oil Inventories
Wed - Jun 04 - 14:00 - Fed Beige Book
Thu - Jun 05 - 07:30 - Challenger Job Report
Thu - Jun 05 - 08:30 - Initial Jobless Claims
Thu - Jun 05 - 10:30 - Natural Gas Inventories
Fri - Jun 06 - 08:30 - Employment Report
This commentary and charts-of-interest are designed to stimulate thinking. This analysis is not a recommendation to buy, sell, hold or sell short any security (stock ETF or otherwise). We all need to think for ourselves when it comes to trading our own accounts. First, it is the only way to really learn. Second, we are the only ones responsible for our decisions. Think of these charts as food for further analysis. Before making a trade, it is important to have a plan. Plan the trade and trade the plan. Among other things, this includes setting a trigger level, a target area and a stop-loss level. It is also important to plan for three possible price movements: advance, decline or sideways. Have a plan for all three scenarios BEFORE making the trade. Consider possible holding times. And finally, look at overall market conditions and sector/industry performance.


