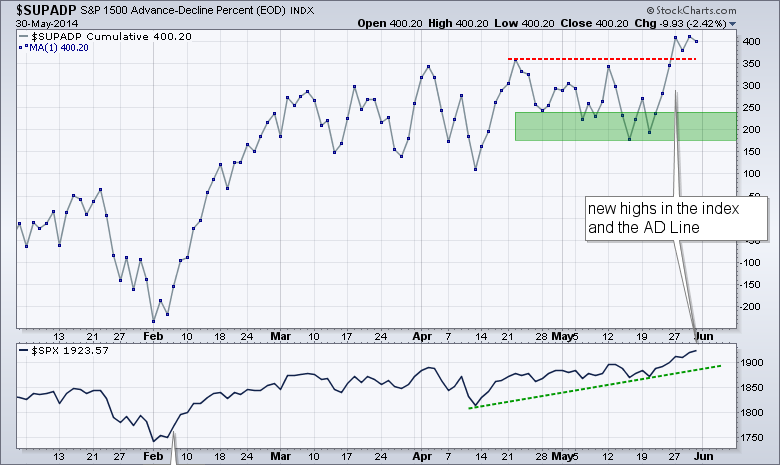
The S&P 500 SPDR and 20+ YR T-Bond ETF extended their uptrends with new highs last week, but this positive correlation could get a big test with a full economic docket this week. The Dow Diamonds, Nasdaq 100 ETF, Equal-Weight S&P 500 ETF and S&P 500 SPDR hit new highs. The Russell 2000 ETF, Russell MicroCap iShares and S&P MidCap SPDR rebounded, but remain well below their spring highs. Even though this creates a discrepancy in the stock market, there is more strength than weakness right now. The chart below confirms as the AD Line for the S&P 1500 moved to a new high last week. This is a broad breadth indicator that includes the S&P 500, S&P MidCap 400 and S&P Small-Cap 600. A new high in the AD Line points to broad participation and supports the overall uptrend in the index. It will be a big week for stocks and bonds because the economic docket is always full at the beginning of the month. This means we will get more clues on the spring thaw and find out if cold weather really is/was to blame for the first quarter. For the economy, I will be watching the ISM Manufacturing Index on Monday, Auto-Truck sales on Tuesday and the ISM Services Index on Wednesday. We also get the employment trio with the ADP Report on Wednesday, jobless claims on Thursday and non-farm payrolls on Friday. Signs of economic growth and an improving labor market would likely weigh on bonds, especially since the 20+ YR T-Bond ETF is quite extended at the moment. Economic disappointments and a sluggish labor market would vindicate the bond market.
**This chart analysis is for educational purposes only, and should not
be construed as a recommendation to buy, sell or sell-short said securities**
*************************************************************
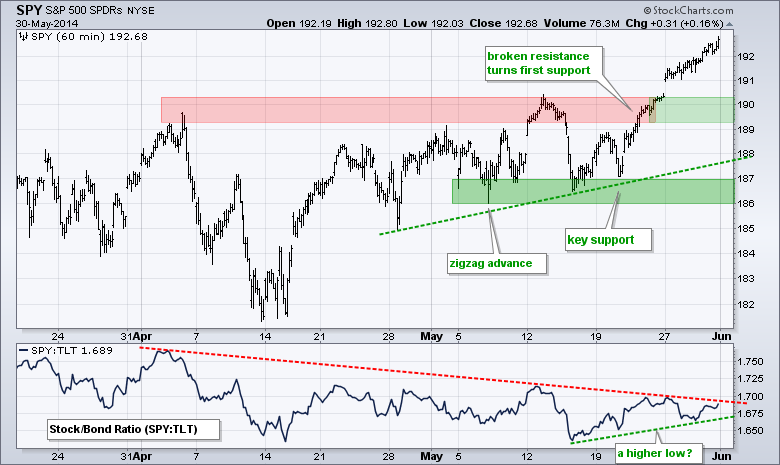
SPY remains the little engine that could. The ETF surged in mid April, zigzagged higher from late April to mid May and then surged again in late May. SPY moved to new highs last week and is up around 3% over the last three weeks. Broken resistance in the 189-190 area turns first support to watch on a throwback. I will leave key support in the 186-187 area for now. The indicator window shows the SPY:TLT ratio attempting a higher low over the last few weeks. A breakout would be positive and signal that stocks are outperforming bonds.
**************************************************************
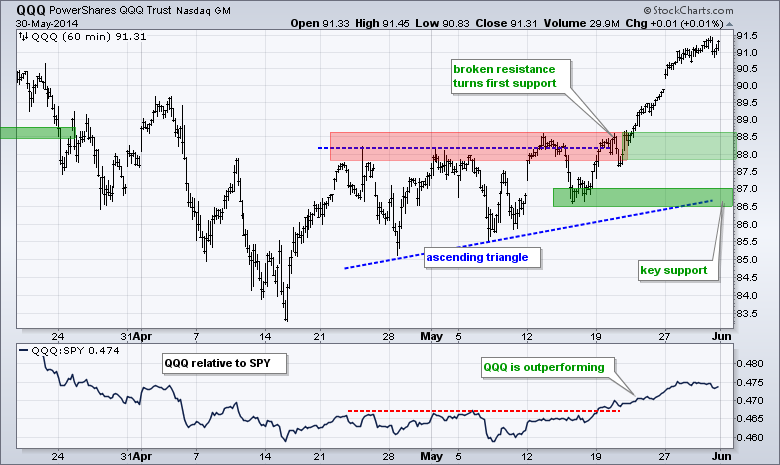
QQQ surged in mid April, formed an ascending triangle (of sorts) from late April to mid May and broke to new highs over the last two weeks. The ETF is up over 5% in 3 weeks and getting frothy, but shows no signs of selling pressure. Broken resistance in the 88-88.5 area turns first support. I will leave key support in the 86.5-87 area for now. The indicator window shows the QQQ:SPY ratio breaking out two weeks ago as QQQ outperforms SPY.
**************************************************************
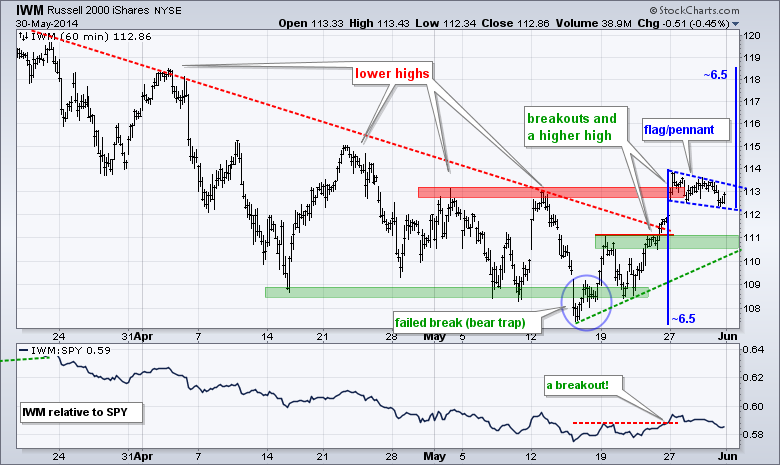
IWM failed to hold the support break in mid May and surged above the mid May highs with a move above 113 last week. The ETF consolidated after this surge with a falling flag, which is a bullish continuation pattern. A breakout at 113.5 would signal a continuation of the prior advance and target a move to the 118-119 area. The distance of the prior move is added to the flag low for a target. Broken resistance in the 110.5-111 area turns first support.
**************************************************************
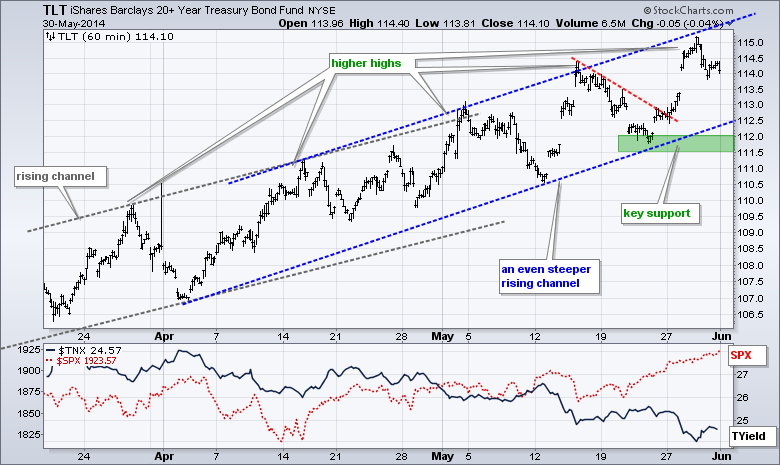
It will be a big week for bonds because the economic docket is full and the employment report is on Friday. TLT remains in a clear uptrend with a series of higher highs and higher lows over the last two months. The ETF broke out early last week to forge its most recent higher low and surged to a new high on Thursday. The lower trend line of a rising channel and the late May lows mark key support in the 111.5-112 area.
**************************************************************
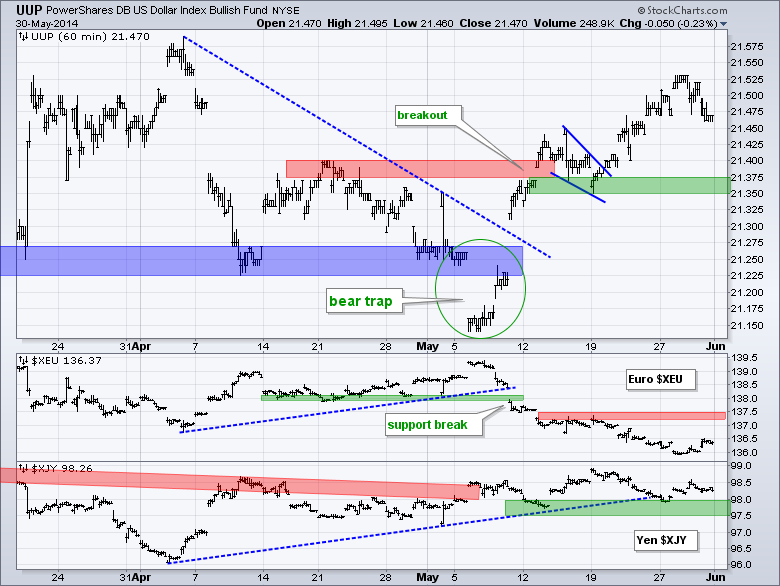
The US Dollar ETF (UUP) remains in bull mode with a series of bullish signals the last four weeks. First, UUP failed to hold the support break in early May and produced a bear trap. Second, the ETF followed through with a break above resistance in mid May. Third, UUP formed a small wedge and broke out with a surge the last two weeks. The wedge lows mark key support in the 21.35-21.375 area. The Euro Index ($XEU) is in bear mode with resistance marked at 137.5.
**************************************************************
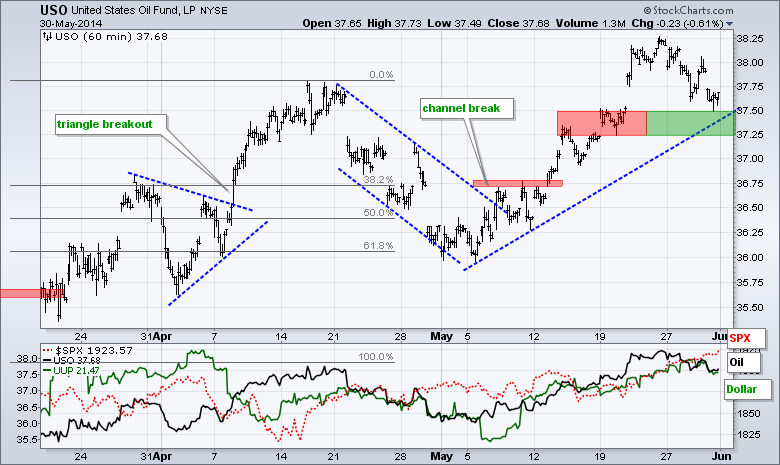
The USO Oil Fund (USO) remains in an uptrend overall with a higher low in early May and a higher high in late May. The ETF fell back last week and is now testing support in the 37.25-37.50 area. Broken resistance and the early May trend line combine to mark support here.
**************************************************************
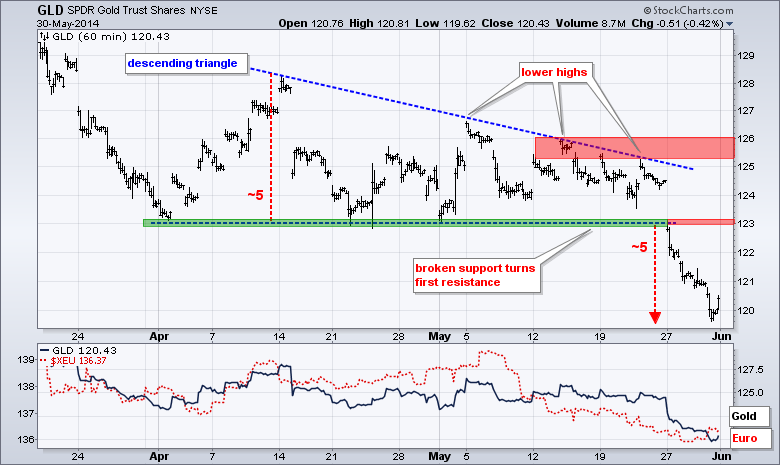
Gold is in a long-term downtrend, medium-term downtrend and short-term downtrend. The Gold SPDR (GLD) formed a descending triangle over the prior eight weeks and broke support with a sharp decline last week. This signals a continuation of the downtrend and targets a move to the 118 area. The mid May highs mark key resistance in the 125-126 area. Broken support in the 123 area turns first resistance.
***************************************************************
Key Reports and Events (all times Eastern):
Mon - Jun 02 - 10:00 - ISM Manufacturing Index
Mon - Jun 02 - 10:00 - Construction Spending
Tue - Jun 03 - 10:00 - Factory Orders
Tue - Jun 03 - 14:00 - Auto/Truck Sales
Wed - Jun 04 - 07:00 - MBA Mortgage Index
Wed - Jun 04 - 08:15 - ADP Employment Report
Wed - Jun 04 - 10:00 - ISM Services Index
Wed - Jun 04 - 10:30 - Crude Oil Inventories
Wed - Jun 04 - 14:00 - Fed Beige Book
Thu - Jun 05 - 07:30 - Challenger Job Report
Thu - Jun 05 - 08:30 - Initial Jobless Claims
Thu - Jun 05 - 10:30 - Natural Gas Inventories
Fri - Jun 06 - 08:30 - Employment Report
This commentary and charts-of-interest are designed to stimulate thinking. This analysis is not a recommendation to buy, sell, hold or sell short any security (stock ETF or otherwise). We all need to think for ourselves when it comes to trading our own accounts. First, it is the only way to really learn. Second, we are the only ones responsible for our decisions. Think of these charts as food for further analysis. Before making a trade, it is important to have a plan. Plan the trade and trade the plan. Among other things, this includes setting a trigger level, a target area and a stop-loss level. It is also important to plan for three possible price movements: advance, decline or sideways. Have a plan for all three scenarios BEFORE making the trade. Consider possible holding times. And finally, look at overall market conditions and sector/industry performance.


