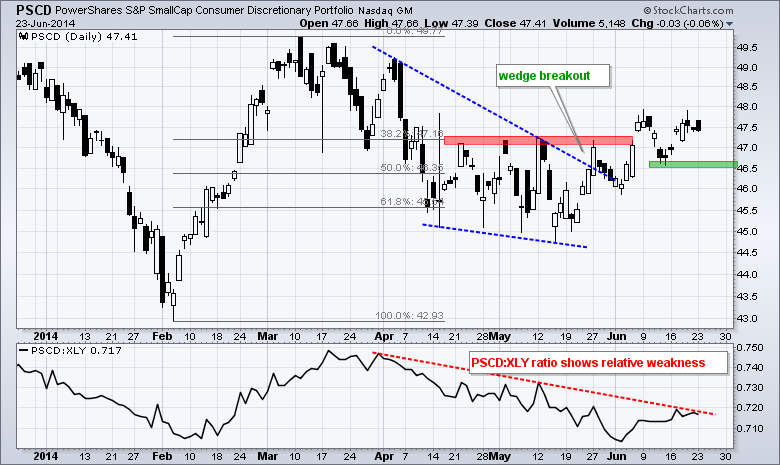
The energizer bunny continues to power the stock market higher. Stocks have been considered overbought several times over the last few weeks, but the uptrend simply trumps everything. Small-caps led the advance last week as the Russell 2000 iShares surged 2.3%. All sectors were up with energy and utilities gaining over 3% for the week. The technology sector was noticeable absent as the Technology SPDR gained just .36% for the week. In addition, the Consumer Discretionary SPDR lagged with a .76% gain. Tech stocks had a good run over the last few weeks so I am not too concerned with one week of relative weakness. XLY on the other hand is the only sector that remains below its March high. Relative weakness in the most economically sensitive sector is a concern, but we have yet to see a break down that would turn this "concern" into an actual negative. The chart below shows the SmallCap Consumer Discretionary ETF (PSCD) breaking wedge resistance in late May and breaking the May highs in early June. Even though this breakout is still holding, the ETF is underperforming the Consumer Discretionary SPDR, which represents the large-cap version. A move below 46.5 would be negative for this key small-cap sector.
**This chart analysis is for educational purposes only, and should not
be construed as a recommendation to buy, sell or sell-short said securities**
**************************************************************
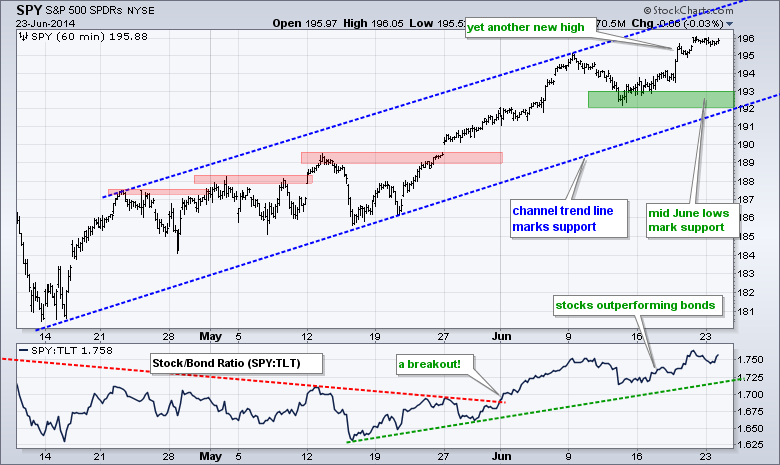
SPY moved to another new high last week and remains in a clear uptrend. This current upswing could extend to the upper trend line of a rising channel. I would not, however, label this upper trend line as a "hard" resistance level. The mid June lows and the lower trend line of the rising channel mark support in the 192-193 area. The SPY:TLT ratio also moved to a new high as stocks outperform bonds.
**************************************************************
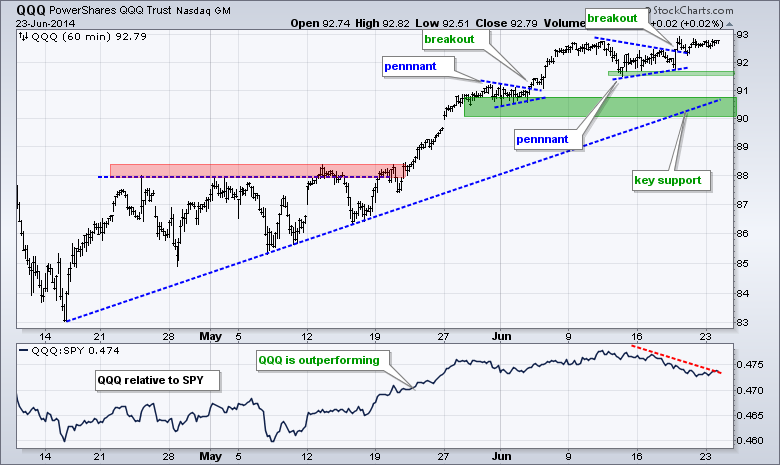
QQQ broke pennant resistance in early June and surged to a new high. Another pennant formed in mid June and the ETF broke out with another surge last week. There was not much follow through and QQQ underperformed the broader market last week. The trend remains up with the mid June lows mark the first support zone in the 91.8-92 area. The early June lows, the mid April trend line and a buffer mark a key support zone in the 90-91 area.
**************************************************************
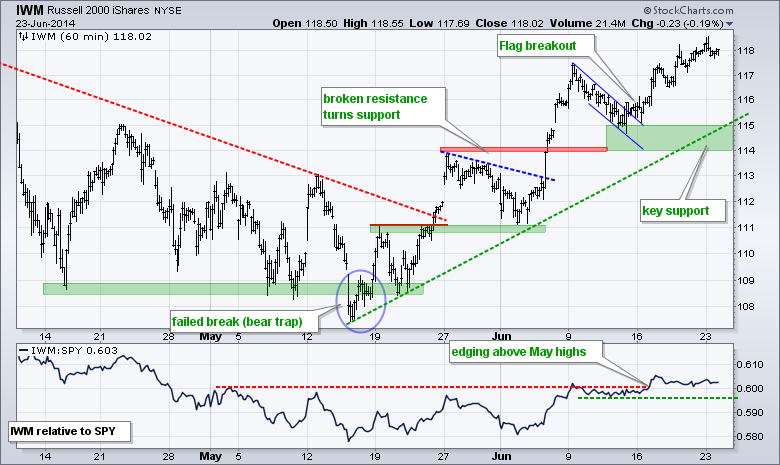
IWM broke flag resistance in mid June and moved to a new high for the move last week. The ETF remains below its March high, but the short-term trend is clearly up as small-caps play a little catch up. Broken resistance and the mid June lows turn support in the 114-115 area. The indicator window shows the IWM:SPY ratio moving higher this month as small-caps outperform large-caps.
**************************************************************
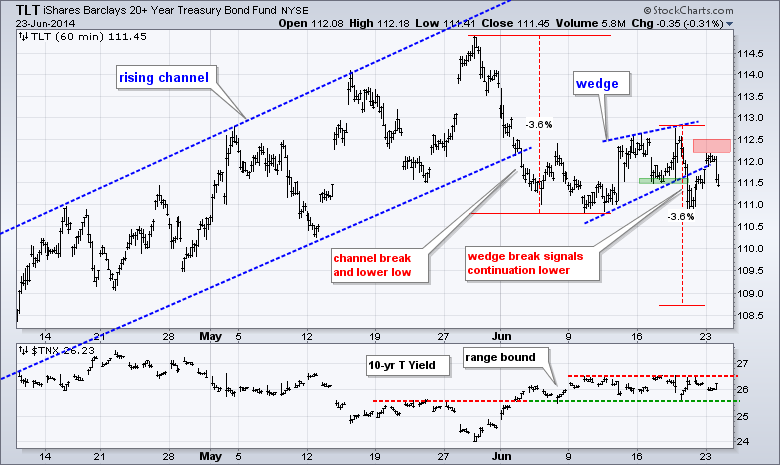
The bond market does not know if the Fed is coming or going. The 20+ YR T-Bond ETF (TLT) broke wedge support with a sharp decline, but then rallied back on Friday. TLT turned back down on Monday and the wedge break remains in play. Based on a measured move, a decline to the 108.7 area is expected. Friday's high and a buffer can be used to mark key resistance at 112.5. The indicator window shows the 10-YR Treasury Yield ($TNX) within a tight range this month. An upside break would be negative for Treasury bonds, while a downside break would be positive.
**************************************************************
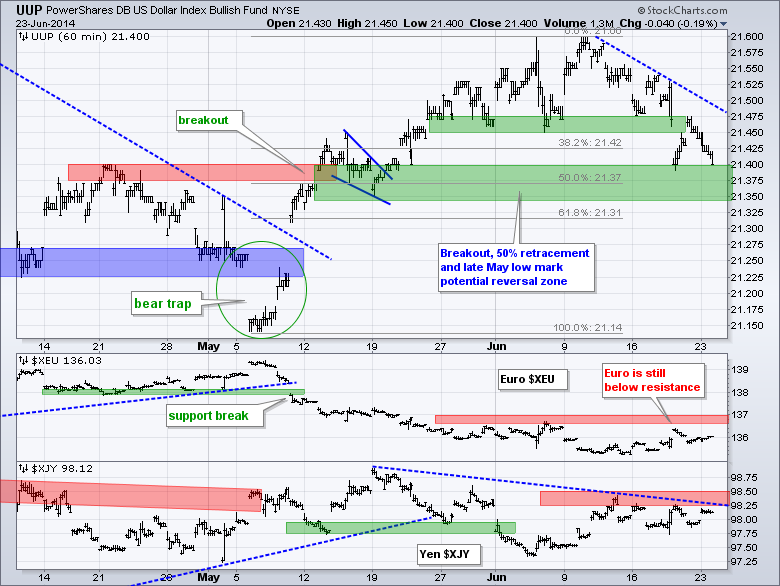
The US Dollar ETF (UUP) fell over the last two weeks and the immediate trend is down. This still looks like a correction after the breakout-surge in May. The breakout zone, 50% retracement and late May low combine to mark a potential reversal zone in the 21.35-21.40 area. The Euro Index ($XEU) is still below resistance at 137, a break of which would be Euro bullish and Dollar bearish.
**************************************************************
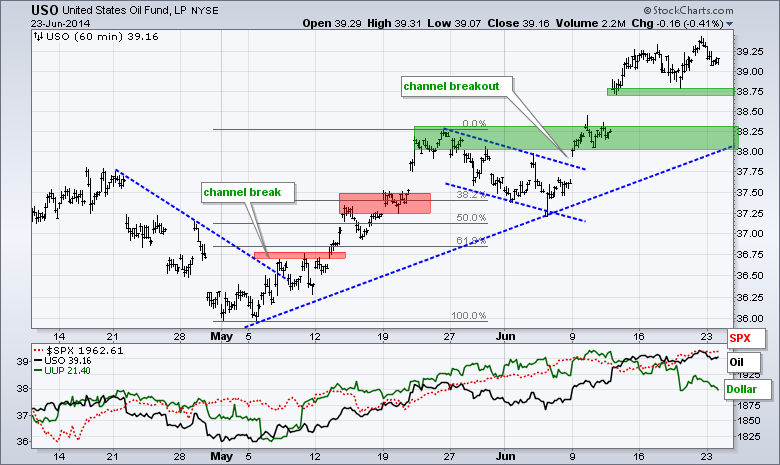
The USO Oil Fund (USO) broke out in early June and surged above 39. The situation in Iraq is likely to remain unstable for a while and this will most affect Iraqi production. This could put a floor on oil prices and limit declines. Last week's low mark first support in the 38.75 area. Broken resistance and the May trend line mark key support in the 38-38.25 area.
**************************************************************
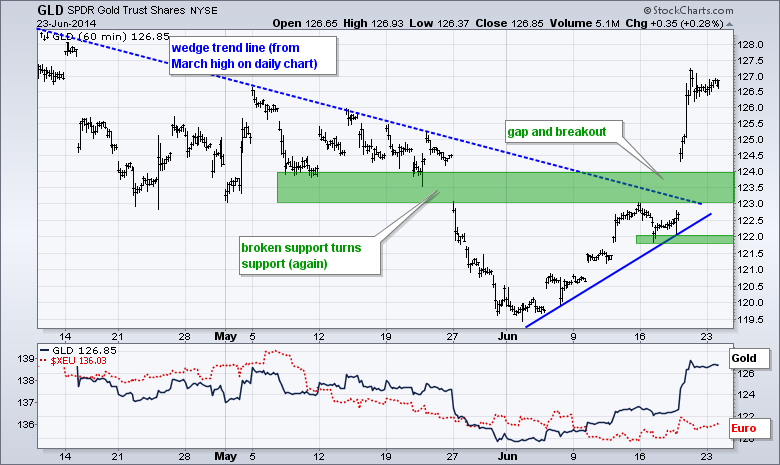
The Gold SPDR (GLD) blew through this resistance zone with a gap and surge above 126. On the daily chart, GLD held above its December low and broke wedge resistance to signal a continuation of the surge from late December to mid March. GLD is obviously overbought right now and the broken resistance zone turns first support in the 123-124 area.
***************************************************************
Key Reports and Events (all times Eastern):
Tue - Jun 24 - 09:00 - Case-Shiller 20-city Index
Tue - Jun 24 - 09:00 - FHFA Housing Price Index
Tue - Jun 24 - 10:00 - New Home Sales
Tue - Jun 24 - 10:00 - Consumer Confidence
Wed - Jun 25 - 07:00 - MBA Mortgage Index
Wed - Jun 25 - 08:30 - Durable Goods Orders
Wed - Jun 25 - 08:30 - GDP
Wed - Jun 25 - 10:30 - Crude Oil Inventories
Thu - Jun 26 - 08:30 - PCE Price Index
Thu - Jun 26 - 08:30 - Initial Jobless Claims
Thu - Jun 26 - 08:30 - Personal Income & Spending
Thu - Jun 26 - 10:30 - Natural Gas Inventories
Fri - Jun 27 - 09:55 - Michigan Sentiment
This commentary and charts-of-interest are designed to stimulate thinking. This analysis is not a recommendation to buy, sell, hold or sell short any security (stock ETF or otherwise). We all need to think for ourselves when it comes to trading our own accounts. First, it is the only way to really learn. Second, we are the only ones responsible for our decisions. Think of these charts as food for further analysis. Before making a trade, it is important to have a plan. Plan the trade and trade the plan. Among other things, this includes setting a trigger level, a target area and a stop-loss level. It is also important to plan for three possible price movements: advance, decline or sideways. Have a plan for all three scenarios BEFORE making the trade. Consider possible holding times. And finally, look at overall market conditions and sector/industry performance.


