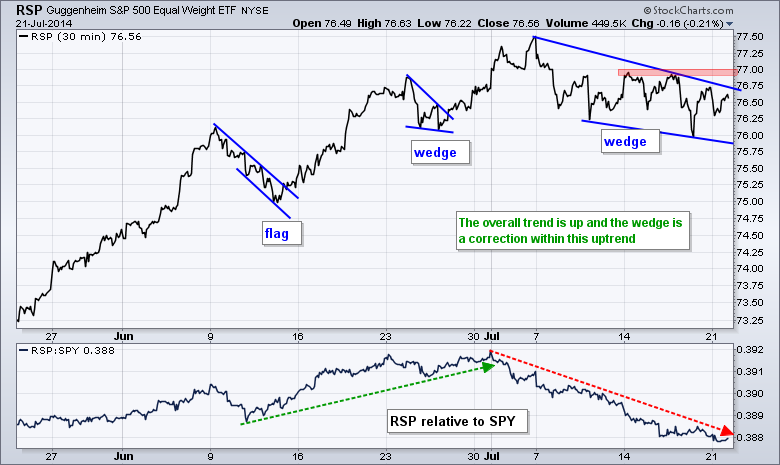
The July funk continues for stocks. After good gains on Friday, some selling pressure hit on Monday and the major index ETFs closed modestly lower. The Russell 2000 iShares fell .40% and the Nasdaq 100 ETF lost just .12% on the day. Eight of the nine sectors were down. The consumer discretionary sector led the way lower with a .46% loss. The energy sector gained as oil moved higher on global tensions. Techs were relatively strong with gains coming to the Semiconductor SPDR and Networking iShares. Overall, July has been a corrective period for the stock market. The chart below shows the Equal-Weight S&P 500 ETF (RSP) peaking in early July and working its way lower with a falling wedge. Last week's highs mark resistance and a break above these levels would signal an end to the correction. The indicator window shows RSP underperforming this month because small and mid-caps bore the brunt of the correction.
**This chart analysis is for educational purposes only, and should not
be construed as a recommendation to buy, sell or sell-short said securities**
*************************************************************
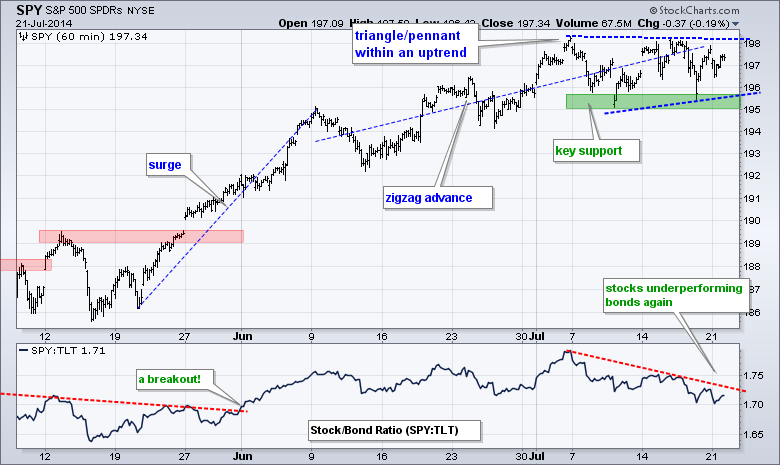
SPY surged from mid May to early June and then zigzagged higher until early July. The ETF moved sideways this month with a triangle/pennant forming. Technically, the trend is up and a consolidation within an uptrend is usually bullish. A break above the upper trend line would signal a continuation higher. The triangle lows mark a support zone in the 195-196 area. The indicator window shows the SPY:TLT ratio moving lower as Treasuries outperform stocks again. This is a negative because it shows a preference for safety.
**************************************************************
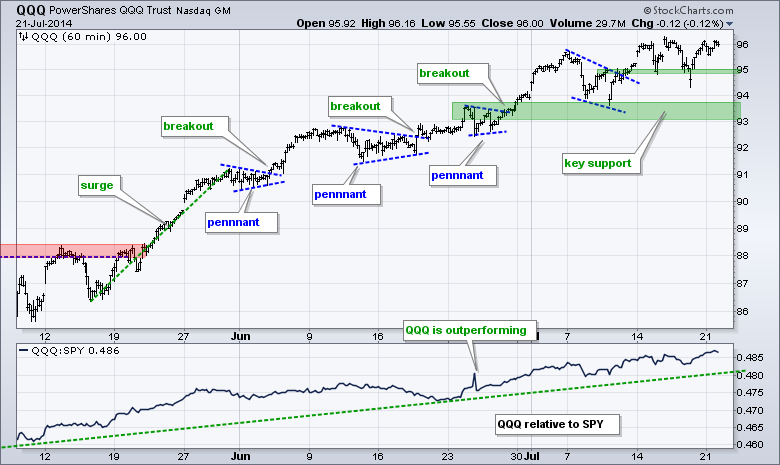
No change: QQQ hit a new high this week and then pulled back sharply on Thursday. The overall trend remains up, but last week's wedge breakout is being challenged with the move below 94.8. Broken resistance, the early July low and a buffer mark key support in the 93-94 area. A break below this zone would reverse the short-term uptrend. Note that Apple reports on Tuesday after the close.
**************************************************************
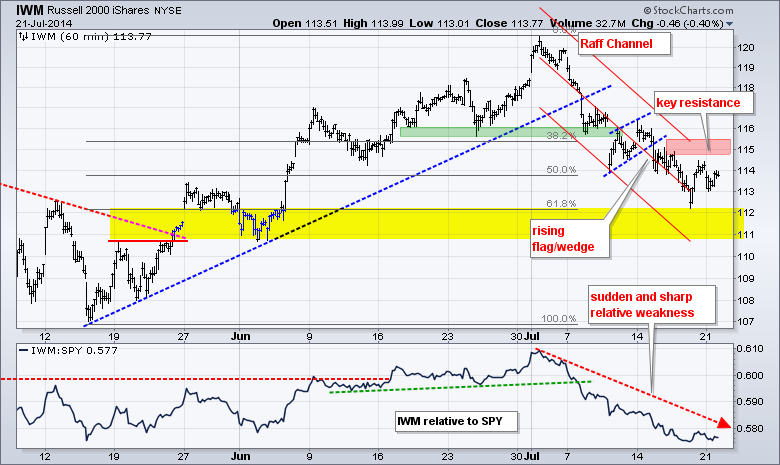
No change: IWM sank to new lows for the move and continues to show relative weakness. The ETF broke wedge support to begin the week and never recovered. I will mark resistance at 115. The next possible support zone is in the 111-112 area. The early June low and 62% retracement mark support here. The indicator window shows the IWM:SPY ratio moving sharply lower over the last three weeks.
**************************************************************
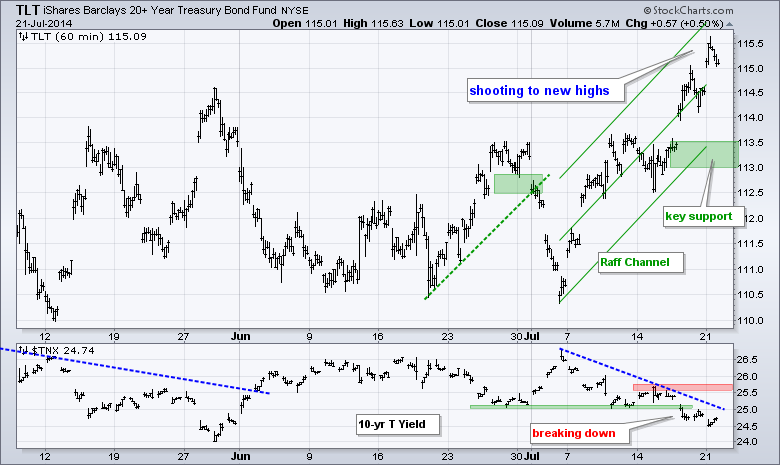
TLT surged to new highs with a sharp advance that began in early July. I am using a Raff Regression Channel to define this advance. The middle line is a linear regression and the outer lines are equidistant. The lower trend line and a buffer mark upswing support in the 113-113.5 area. The indicator window shows the 10-YR Treasury Yield ($TNX) breaking below its June low.
**************************************************************
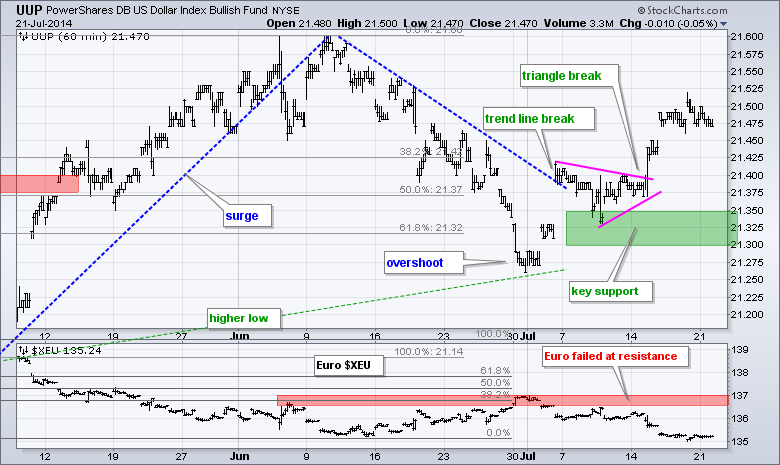
No change: The Dollar held its gains on Thursday and remains in an uptrend. UUP broke the trend line in early July and then the triangle trend line. The triangle lows and a buffer mark key support in the 21.3-21.35 area. The Euro Index ($XEU) failed at 137 and moved to its mid June lows. The Dollar should be considered bullish as long as the Euro is below 137 and in a downtrend.
**************************************************************
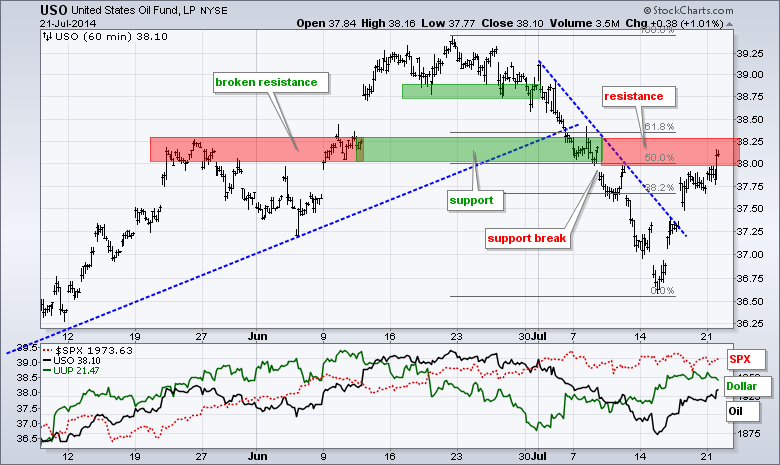
No change: USO broke down in early July and plunged below 37 in mid July. The ETF got a sharp snap-back rally with a surge above 37.50 on Thursday. Turmoil in Ukraine, Gaza and Iraq could be helping the bid in oil. The break above the blue trend line is positive as long as 37.25 holds. I do, however, see potential resistance in the 38-38.25 area from broken support and the 50-62% retracement zone.
**************************************************************
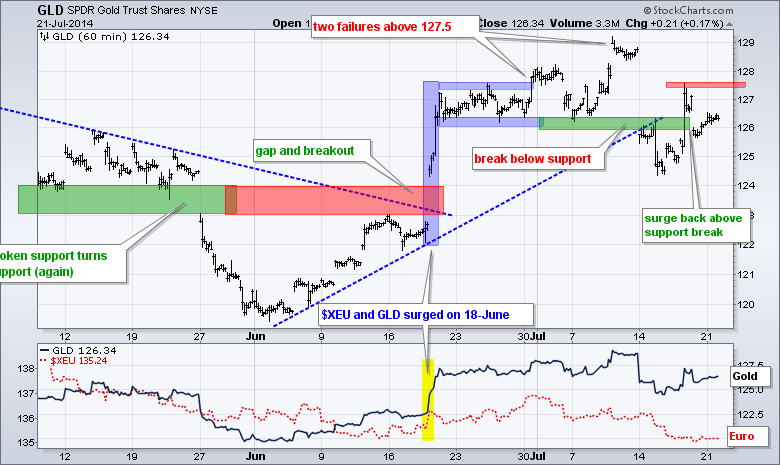
No change: Events in Gaza and Ukraine also put a bid into gold as GLD surged above 126. This negates the support break, but I find it hard to base trades on event-driven moves, especially events that are either a one off (Malaysia airliner) or unsurprising (Gaza). Frankly, the charts for oil and gold are messed up right now and I would just let the dust settle.
***************************************************************
Key Reports and Events (all times Eastern):
Tue - Jul 22 - 08:30 - CPI
Tue - Jul 22 - 09:00 - FHFA Housing Price Index
Tue - Jul 22 - 10:00 - Existing Home Sales
Wed - Jul 23 - 07:00 - MBA Mortgage Index
Wed - Jul 23 - 10:30 - Crude Inventories
Thu - Jul 24 - 08:30 - Initial Claims
Thu - Jul 24 - 10:00 - New Home Sales
Thu - Jul 24 - 10:30 - Natural Gas Inventories
Fri - Jul 25 - 08:30 - Durable Orders
This commentary and charts-of-interest are designed to stimulate thinking. This analysis is not a recommendation to buy, sell, hold or sell short any security (stock ETF or otherwise). We all need to think for ourselves when it comes to trading our own accounts. First, it is the only way to really learn. Second, we are the only ones responsible for our decisions. Think of these charts as food for further analysis. Before making a trade, it is important to have a plan. Plan the trade and trade the plan. Among other things, this includes setting a trigger level, a target area and a stop-loss level. It is also important to plan for three possible price movements: advance, decline or sideways. Have a plan for all three scenarios BEFORE making the trade. Consider possible holding times. And finally, look at overall market conditions and sector/industry performance.


