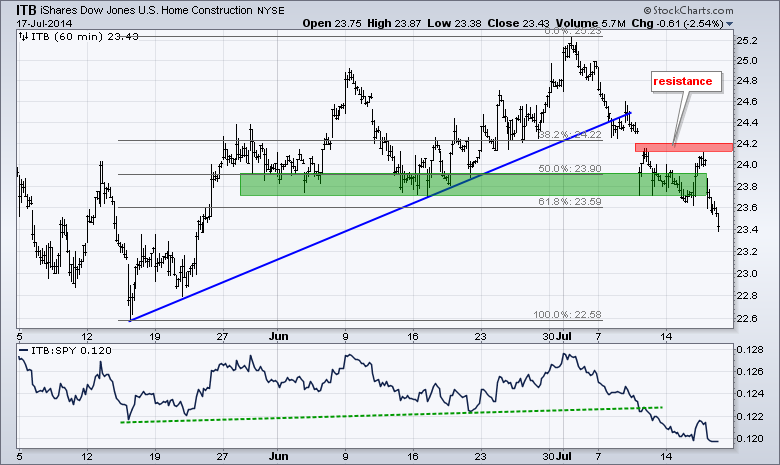
Stocks opened slightly lower and then slid as news reports suggested that the Malaysian airliner was shot down. There was a small bounce around midday and stocks again came under selling pressure in the afternoon. Small-caps led the way lower as IWM fell around 1.5%. All sectors were lower with energy, industrials, finance and technology losing over 1%. The Home Construction iShares got clobbered with a 2.54% loss as housing starts missed big. Note that the Home Construction iShares (ITB), Regional Bank SPDR (KRE) and Russell 2000 iShares (IWM) have been trending lower throughout the month. ITB and KRE broke support this week. The chart below shows ITB moving below its June lows with a gap down and sharp decline on Thursday. The indicator window shows the ITB:SPY ratio breaking down as ITB underperforms SPY. Programming note: I will be taking off Monday and Art's Charts will return on Tuesday, July 22nd.
**This chart analysis is for educational purposes only, and should not
be construed as a recommendation to buy, sell or sell-short said securities**
*************************************************************
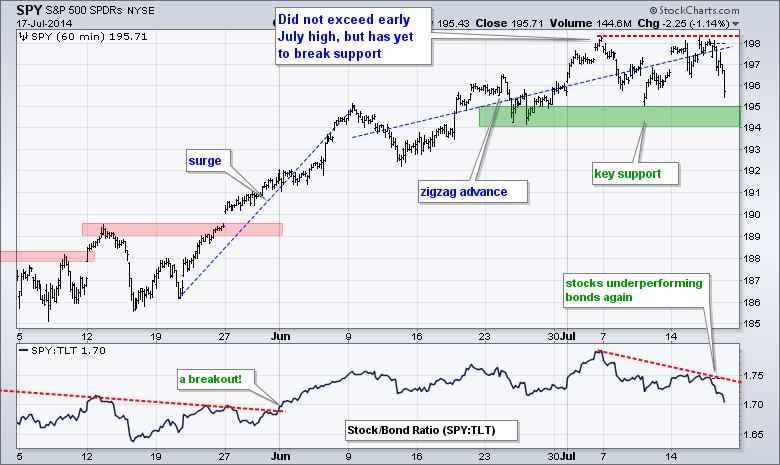
SPY failed to take out its early July high and fell sharply on Thursday. Even though a lower high may be forming, the ETF has yet to break support and actually reverse the short-term uptrend. I am leaving the key support zone in the 194-195 area. The indicator window shows the SPY:TLT ratio moving lower as Treasuries outperform stocks again. This is a negative because it shows a preference for safety.
**************************************************************
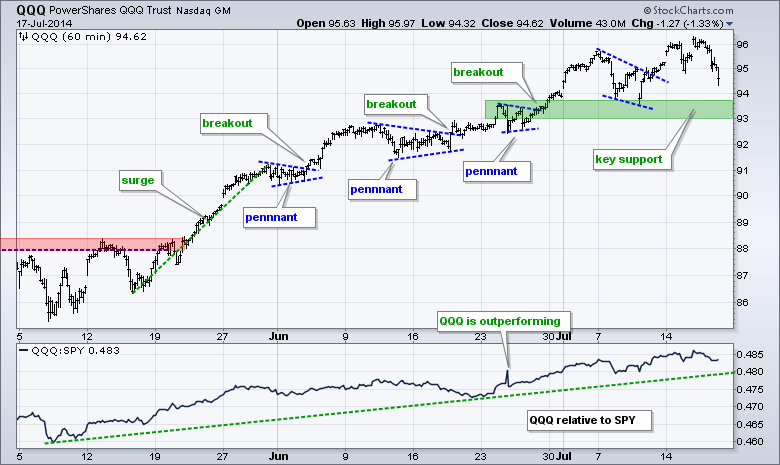
QQQ hit a new high this week and then pulled back sharply on Thursday. The overall trend remains up, but last week's wedge breakout is being challenged with the move below 94.8. Broken resistance, the early July low and a buffer mark key support in the 93-94 area. A break below this zone would reverse the short-term uptrend. Note that Apple reports on Tuesday after the close.
**************************************************************
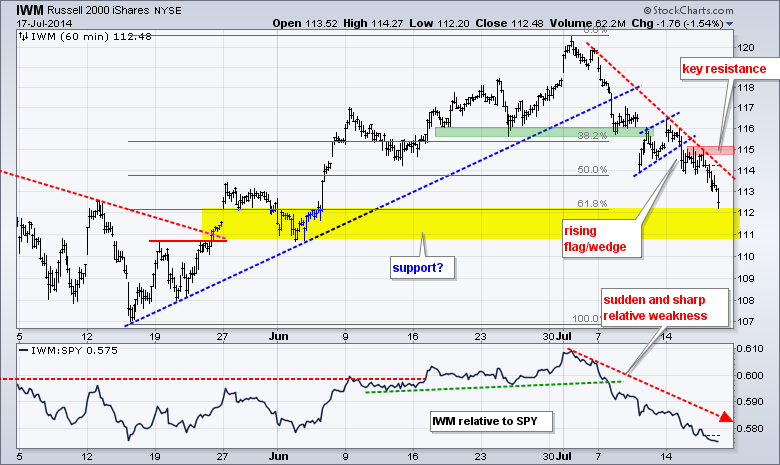
IWM sank to new lows for the move and continues to show relative weakness. The ETF broke wedge support to begin the week and never recovered. I will mark resistance at 115. The next possible support zone is in the 111-112 area. The early June low and 62% retracement mark support here. The indicator window shows the IWM:SPY ratio moving sharply lower over the last three weeks.
**************************************************************
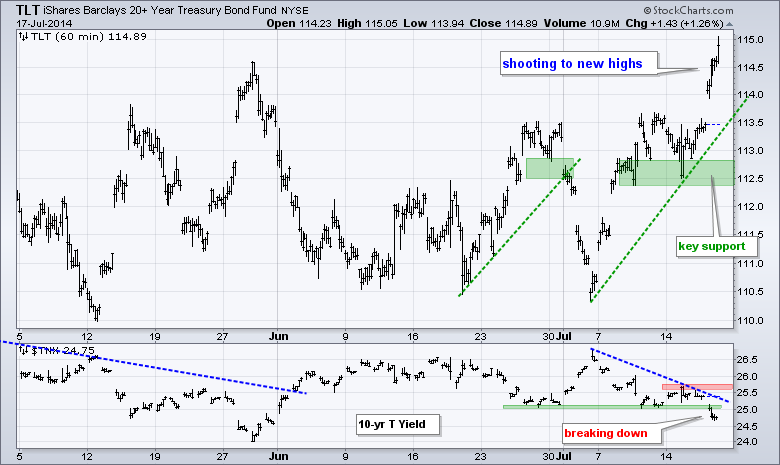
TLT surged to new highs with a strong open and strong close a flight to safety. There are also reports of Chinese buying. Whatever the case, TLT held support and the 10-YR Treasury Yield did not. The mid July lows mark a support zone in the 112.5 area for TLT and the mid July highs mark a resistance zone for $TNX.
**************************************************************
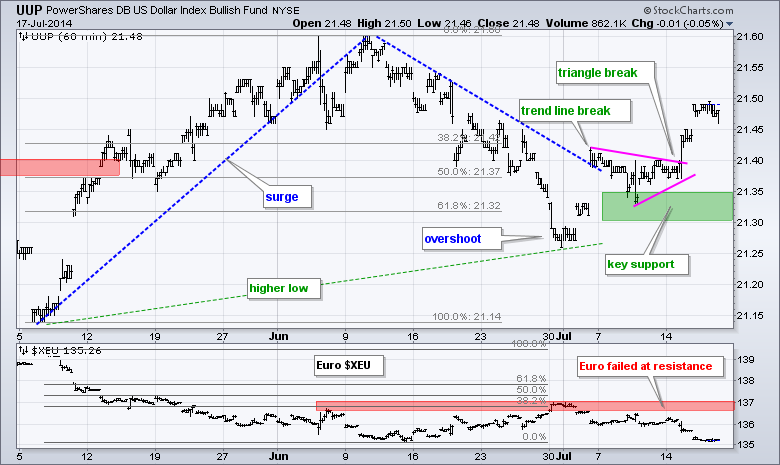
The Dollar held its gains on Thursday and remains in an uptrend. UUP broke the trend line in early July and then the triangle trend line. The triangle lows and a buffer mark key support in the 21.3-21.35 area. The Euro Index ($XEU) failed at 137 and moved to its mid June lows. The Dollar should be considered bullish as long as the Euro is below 137 and in a downtrend.
**************************************************************
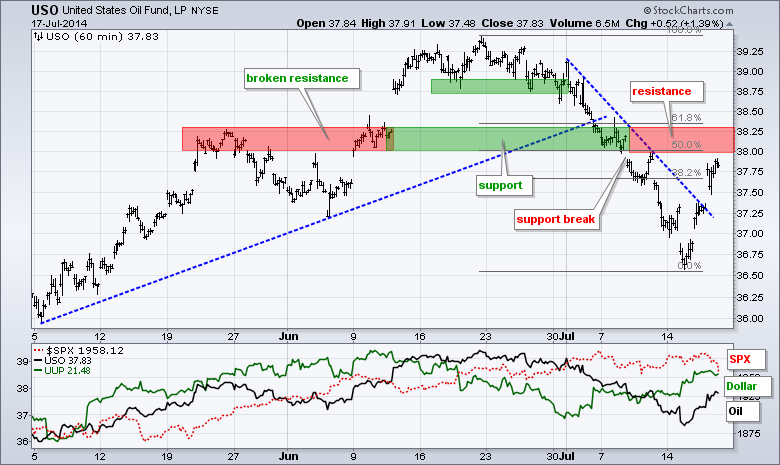
USO broke down in early July and plunged below 37 in mid July. The ETF got a sharp snap-back rally with a surge above 37.50 on Thursday. Turmoil in Ukraine, Gaza and Iraq could be helping the bid in oil. The break above the blue trend line is positive as long as 37.25 holds. I do, however, see potential resistance in the 38-38.25 area from broken support and the 50-62% retracement zone.
**************************************************************
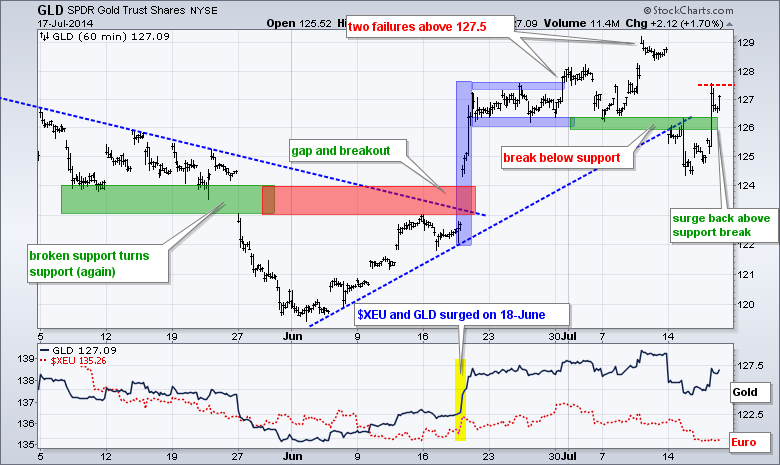
Events in Gaza and Ukraine also put a bid into gold as GLD surged above 126. This negates the support break, but I find it hard to base trades on event-driven moves, especially events that are either a one off (Malaysia airliner) or unsurprising (Gaza). Frankly, the charts for oil and gold are messed up right now and I would just let the dust settle.
***************************************************************
Key Reports and Events (all times Eastern):
Fri - Jul 18 - 09:55 - Michigan Sentiment
Fri - Jul 18 - 10:00 - Leading Economic Indicators
This commentary and charts-of-interest are designed to stimulate thinking. This analysis is not a recommendation to buy, sell, hold or sell short any security (stock ETF or otherwise). We all need to think for ourselves when it comes to trading our own accounts. First, it is the only way to really learn. Second, we are the only ones responsible for our decisions. Think of these charts as food for further analysis. Before making a trade, it is important to have a plan. Plan the trade and trade the plan. Among other things, this includes setting a trigger level, a target area and a stop-loss level. It is also important to plan for three possible price movements: advance, decline or sideways. Have a plan for all three scenarios BEFORE making the trade. Consider possible holding times. And finally, look at overall market conditions and sector/industry performance.


