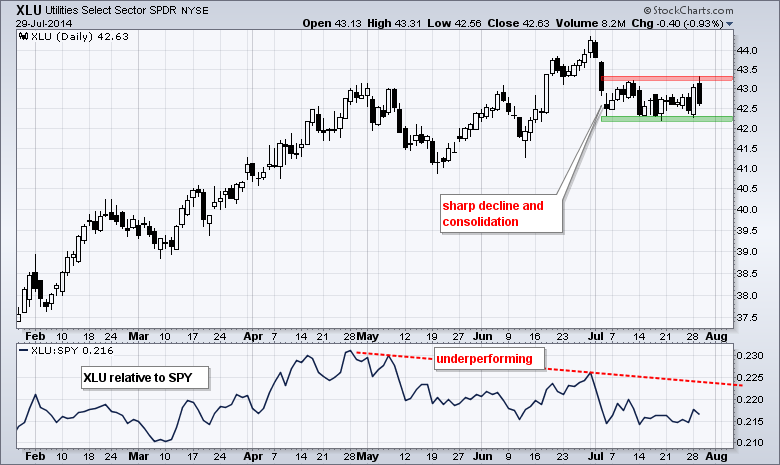
It was another mixed day, but the usual performance mix got turned around. Note that the Russell 2000 iShares and Russell MicroCap iShares gained on the day, but the Nasdaq 100 ETF and S&P 500 SPDR lost ground. It is usually the other way around. I would not go so far as to call this the start of a small-cap rebound, but it is a start and we should watch IWM closely in the coming days. After a big bounce on Monday, the Utilities SPDR (XLU) took a hit on Tuesday and gave most of it back. On the chart below, notice how XLU fell sharply in early July and then consolidated the last few weeks. A break below consolidation support would signal a continuation of the early July decline.
**This chart analysis is for educational purposes only, and should not
be construed as a recommendation to buy, sell or sell-short said securities**
*************************************************************
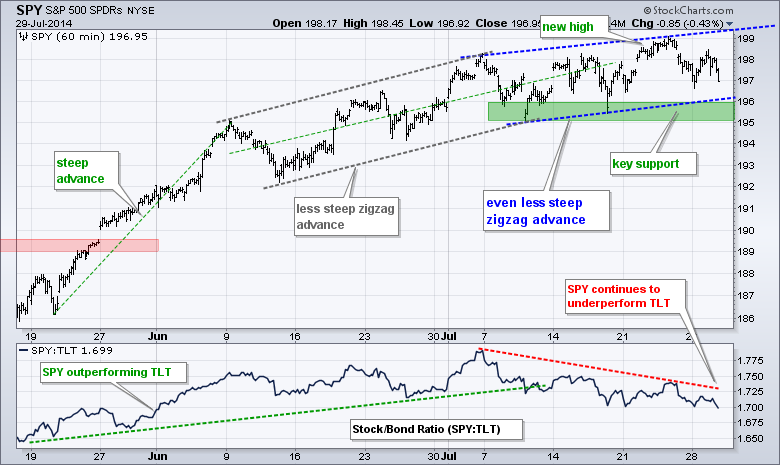
SPY fell into the lower half of the rising channel, which extends up from early July. For the moment, this channel defines the uptrend with key support in the 195-196 area. It is a slow and boring advance, but there is no sense thinking trend change as long as the channel holds.
**************************************************************
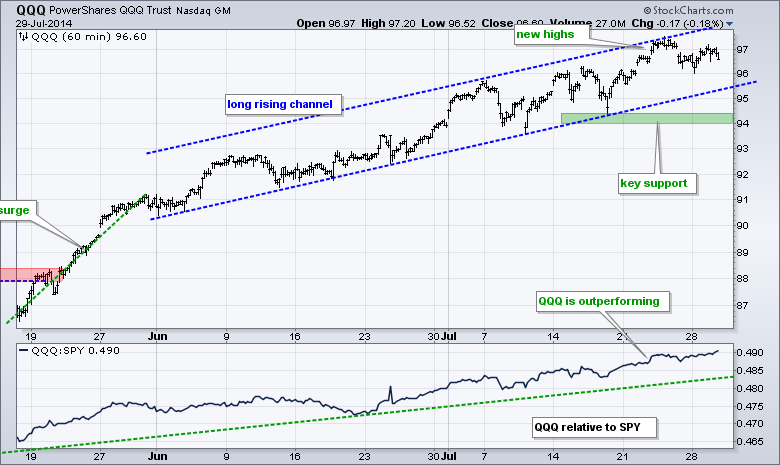
QQQ surged in late May and then moved into a rising channel over the last eight weeks. The ETF retreated from the upper trend line on Friday and could now move towards the lower trend line with a mild correction. The mid July low marks key support in the 94-94.5 area. QQQ continues to outperform SPY.
**************************************************************
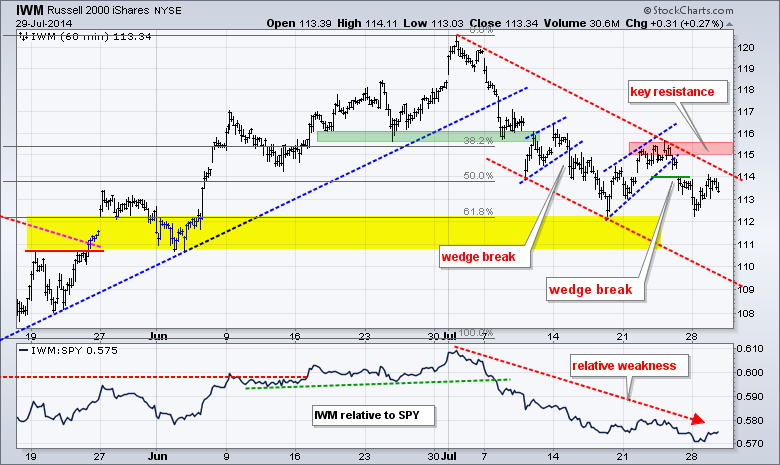
IWM broke wedge support last week and rebounded this week. It is not enough, however, to reverse the downtrend. IWM is at an interesting juncture because it retraced 62% of the May-June advance and firmed in the 112-113 area. The red channel defines the current downswing and it would take a break above 115.5 to reverse this short-term downtrend.
**************************************************************
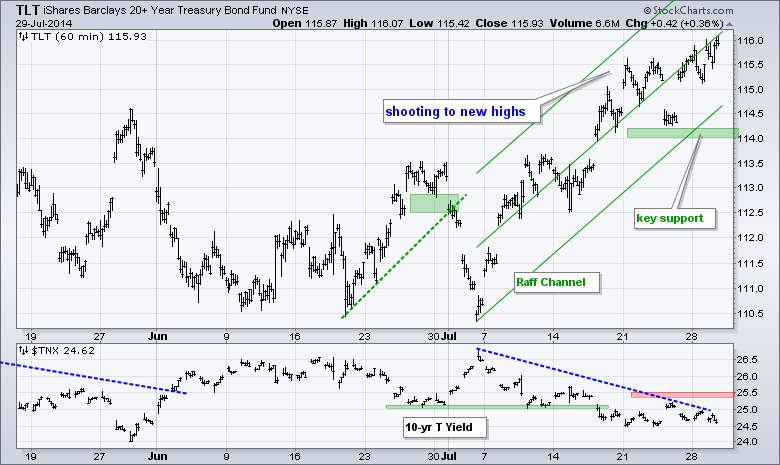
TLT surged to yet another new high ahead of the Fed policy statement and the employment report. Frankly, bonds have some chutzpah to rally ahead of an employment report that will likely be positive for the economy. It is what it is. The Raff channel and late July low mark key support in the 114-114.5 area.
**************************************************************
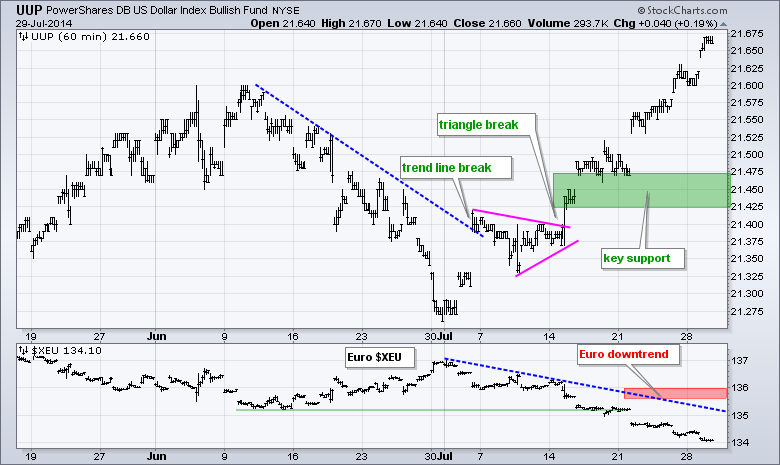
UUP continued higher and exceeded its June high. No weakness here. I will leave key support at 21.425-21.45 for now. The Euro Index ($XEU) continued lower and key resistance is set at 136.
**************************************************************
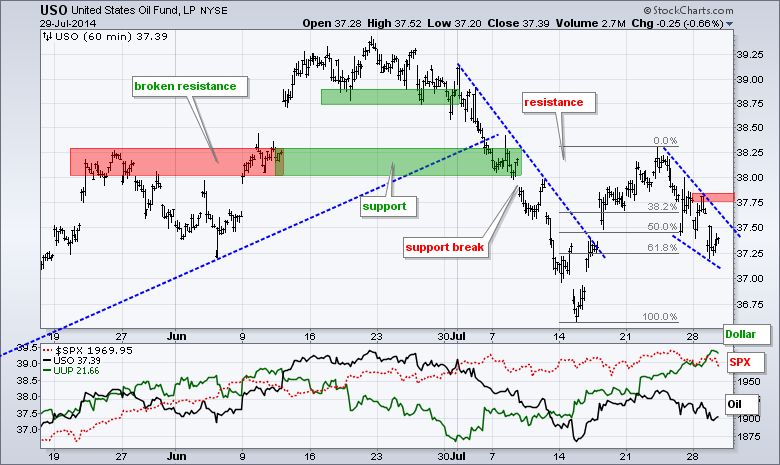
USO fell back and has now retraced 62% of the mid July bounce. The trend is down, but this is an area to watch because a falling wedge is taking shape. Look for a break above this week's high to reverse the wedge.
**************************************************************
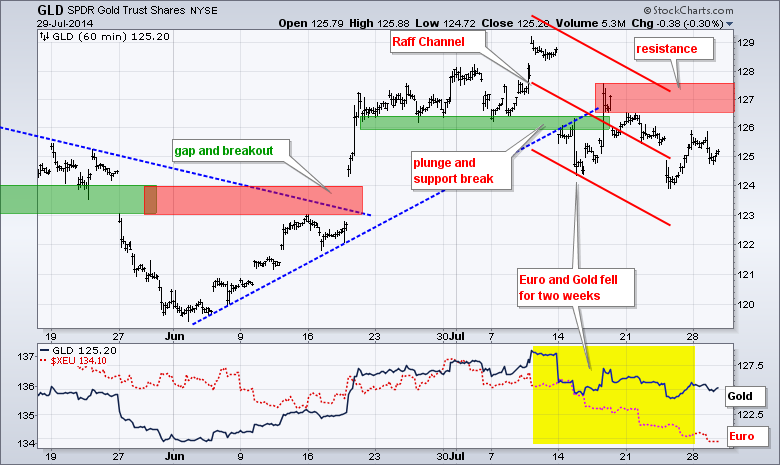
GLD remains in a downtrend defined by the Raff Regression Channel and the mid July high. This could be a corrective decline because GLD has retraced around 50% of the prior advance. The immediate trend is down though and GLD needs to clear 127.5 to reverse this decline. Such a move would make this a correction and signal a continuation of the prior advance.
***************************************************************
Key Reports and Events (all times Eastern):
Wed - Jul 30 - 07:00 - MBA Mortgage Index
Wed - Jul 30 - 08:15 - ADP Employment Report
Wed - Jul 30 - 08:30 - GDP
Wed - Jul 30 - 10:30 - Crude Oil Inventories
Wed - Jul 30 - 14:00 - FOMC Policy Statement
Thu - Jul 31 - 07:30 - Challenger Job Report
Thu - Jul 31 - 08:30 - Initial Jobless Claims
Thu - Jul 31 - 09:45 - Chicago PMI
Thu - Jul 31 - 10:30 - Natural Gas Inventories
Fri - Aug 01 - 08:30 - Employment Report
Fri - Aug 01 - 08:30 - Personal Income & Spending
Fri - Aug 01 - 08:30 - PCE Prices
Fri - Aug 01 - 09:55 - Michigan Sentiment
Fri - Aug 01 - 10:00 - ISM Index
Fri - Aug 01 - 10:00 - Construction Spending
Fri - Aug 01 - 14:00 - Auto/Truck Sales
This commentary and charts-of-interest are designed to stimulate thinking. This analysis is not a recommendation to buy, sell, hold or sell short any security (stock ETF or otherwise). We all need to think for ourselves when it comes to trading our own accounts. First, it is the only way to really learn. Second, we are the only ones responsible for our decisions. Think of these charts as food for further analysis. Before making a trade, it is important to have a plan. Plan the trade and trade the plan. Among other things, this includes setting a trigger level, a target area and a stop-loss level. It is also important to plan for three possible price movements: advance, decline or sideways. Have a plan for all three scenarios BEFORE making the trade. Consider possible holding times. And finally, look at overall market conditions and sector/industry performance.


