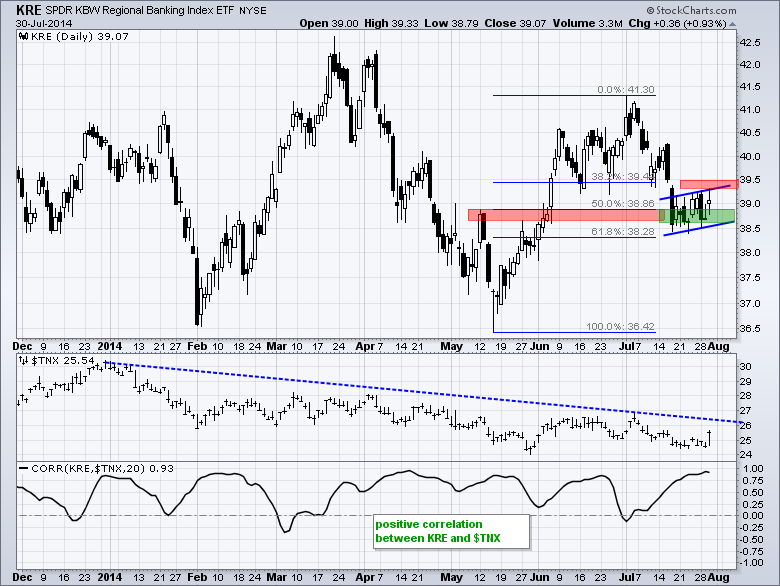
It was yet another mixed day on Wall Street. As with Tuesday, small-caps and micro-caps were up and showed some relative strength. QQQ and techs were also up, but DIA and the Equal-Weight S&P 500 ETF edged lower. Five of the nine sectors were up with consumer discretionary and finance leading the way. This is positive for the market overall. Also note that the utilities and consumer staples sectors were the weakest as both declined over 1%. The Regional Bank SPDR (KRE) advanced almost 1% as the 10-YR Treasury Yield ($TNX) moved above 2.50%. The chart below shows KRE stalling with what looks like a flag, and a break below flag support would signal a continuation lower. The ETF, however, is at an interesting juncture that could be bullish. Notice that KRE is firming in the 50-62% retracement zone and near broken resistance, which turns into support. A break above 39.50 would be bullish. Keep an eye on the 10-YR Treasury Yield ($TNX) because a break above 27 (2.7%) would reverse the 2014 downtrend in Treasury yields. Sorry, there are no chart setups today because the stocks that came up in my scanning and chart scrolling all report earnings withing a week and that creates extra risk.
**This chart analysis is for educational purposes only, and should not
be construed as a recommendation to buy, sell or sell-short said securities**
*************************************************************
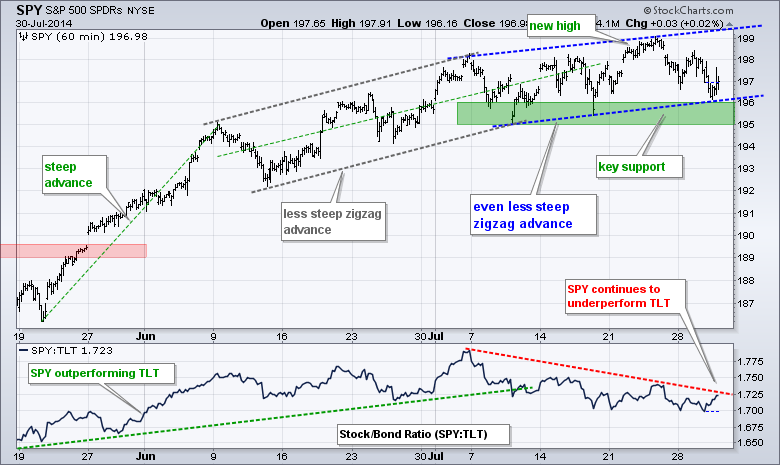
SPY moved to the lower end of the rising channel for a support test ahead of Friday's employment report. While a break below the channel trend line would be negative, there is still a lot of support from the early and mid July lows in the 195-196 area.
**************************************************************
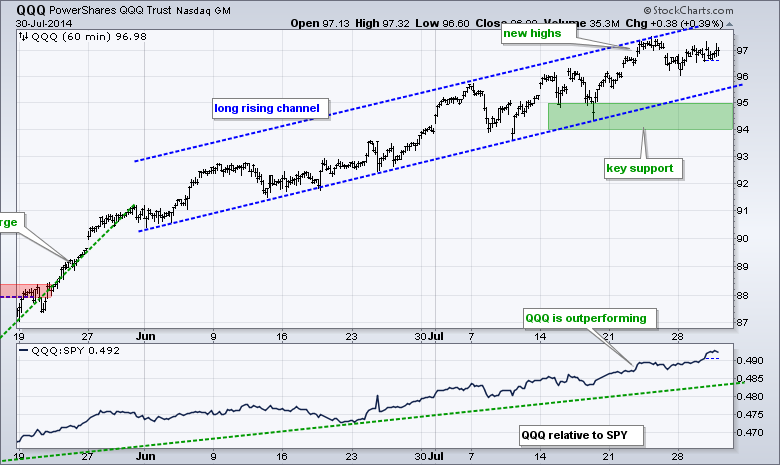
QQQ stalled over the past week, but remains within the rising channel and continues to show relative strength as the price relative hit another new high. The mid July lows mark key support in the 94-95 area.
**************************************************************
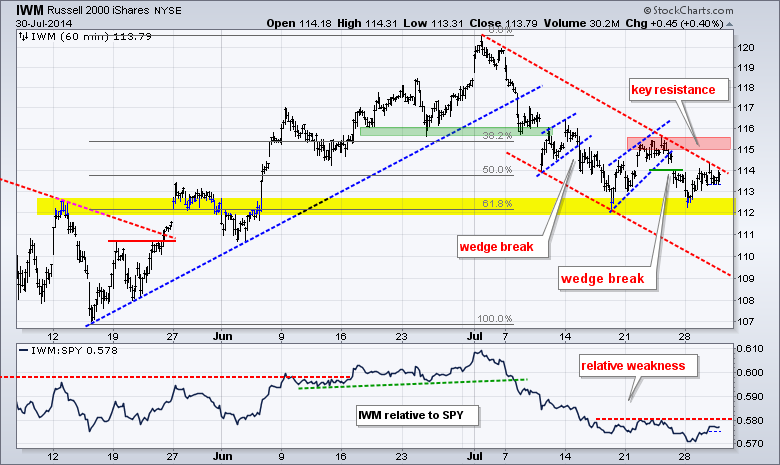
IWM held up relatively well for the second session running. The ETF remains at a very interesting juncture because it found support near the 62% retracement and broken resistance. A breakout at 115.5 would reverse the July slide and signal a continuation of the prior advance (107 to 120).
**************************************************************
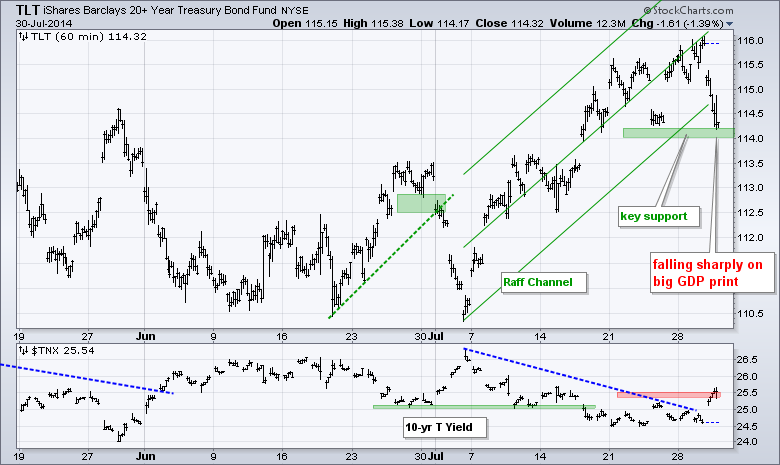
TLT fell sharply on news that second quarter GDP rebounded. The ETF broke the lower trend line of the Raff channel and is now testing support in the 114 area. A follow thru break here would reverse the upswing. The indicator window shows the 10-YR Treasury Yield ($TNX) making a breakout bid as Treasury yields move higher.
**************************************************************
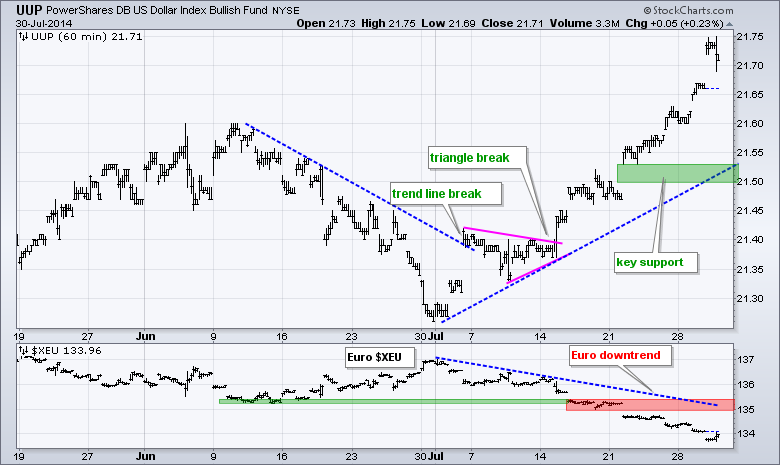
The Euro sank and the Dollar surged. Strong economic numbers boosted the Dollar because this puts pressure on the Fed to tighten monetary policy or at least normalize. The uptrend remains in play since the triangle breakout and I am raising support for UUP to 21.50. Resistance for the Euro Index ($XEU) is set at 135.50.
**************************************************************
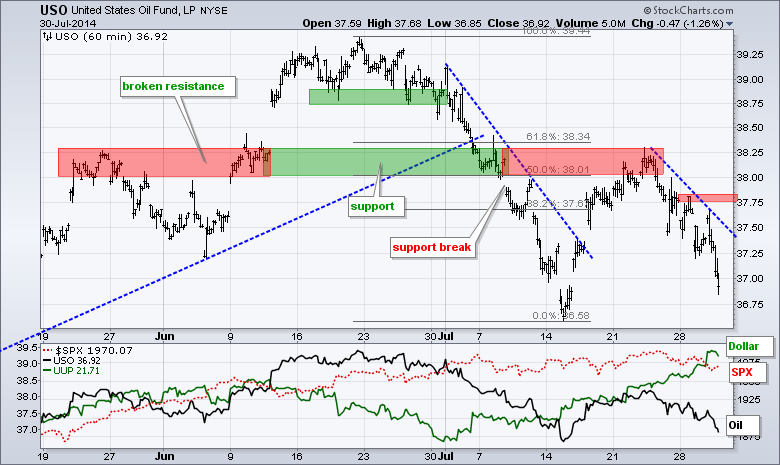
A strong Dollar could be hurting oil as USO fell sharply this week. Notice how USO failed at the 62% retracement last week. It looked like a wedge was taking shape, but this wedge has been negated with the sharp decline below 37.
**************************************************************
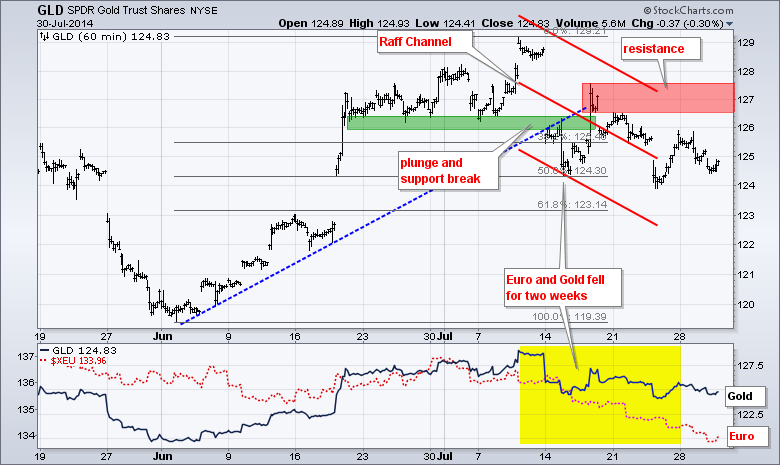
GLD held up over the last few weeks, but may be vulnerable to a strong Dollar. The trend since mid July remains down and the bears have the edge as long as key resistance at 127.5 holds. This three week slide could be a correction, but we need to see some sort of upside catalyst and breakout before acting.
***************************************************************
Key Reports and Events (all times Eastern):
Thu - Jul 31 - 07:30 - Challenger Job Report
Thu - Jul 31 - 08:30 - Initial Jobless Claims
Thu - Jul 31 - 09:45 - Chicago PMI
Thu - Jul 31 - 10:30 - Natural Gas Inventories
Fri - Aug 01 - 08:30 - Employment Report
Fri - Aug 01 - 08:30 - Personal Income & Spending
Fri - Aug 01 - 08:30 - PCE Prices
Fri - Aug 01 - 09:55 - Michigan Sentiment
Fri - Aug 01 - 10:00 - ISM Index
Fri - Aug 01 - 10:00 - Construction Spending
Fri - Aug 01 - 14:00 - Auto/Truck Sales
This commentary and charts-of-interest are designed to stimulate thinking. This analysis is not a recommendation to buy, sell, hold or sell short any security (stock ETF or otherwise). We all need to think for ourselves when it comes to trading our own accounts. First, it is the only way to really learn. Second, we are the only ones responsible for our decisions. Think of these charts as food for further analysis. Before making a trade, it is important to have a plan. Plan the trade and trade the plan. Among other things, this includes setting a trigger level, a target area and a stop-loss level. It is also important to plan for three possible price movements: advance, decline or sideways. Have a plan for all three scenarios BEFORE making the trade. Consider possible holding times. And finally, look at overall market conditions and sector/industry performance.


