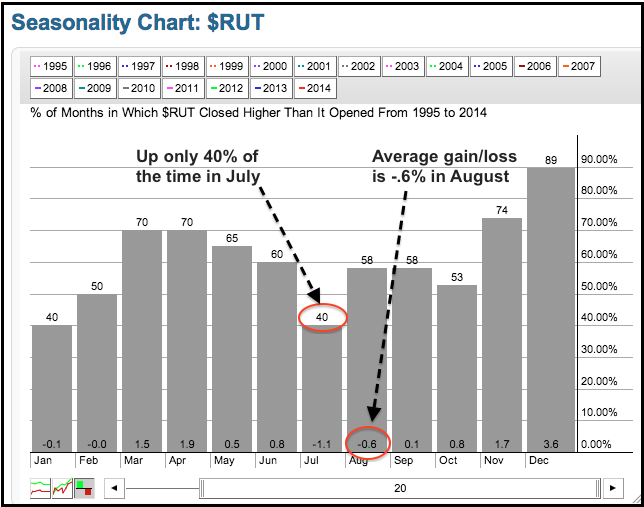
The high-beta names (i.e. momentum stocks) got hammered again on Tuesday. The Russell 2000 iShares fell over 1%, the Internet ETF fell 3%, the Solar Energy ETF declined over 3.5% and the Biotech SPDR lost 3.77%. It is beginning to look a lot like March. Note that momentum names peaked in late February and early March. Momentum stocks fell apart in March and selling pressure extended into April and early May. Seasonally, July and August are the weakest months for the Russell 2000. As the chart below shows, the index was up only 40% of the time in July over the last 20 years. The index was up 58% of the time in August, but the average gain/loss was a loss of .6 percent. The seasonal patterns are not favorable right now.
**This chart analysis is for educational purposes only, and should not
be construed as a recommendation to buy, sell or sell-short said securities**
*************************************************************
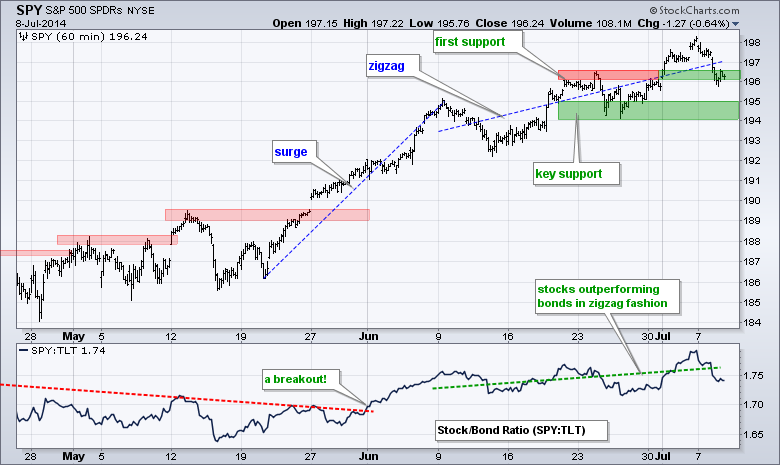
SPY hit a new high near 198 last week and then fell back to the 196 area this week. The two day decline is sharp, but it fits within the zigzag pattern we have seen since early June. The short-term trend is up as long as this zigzag continues making higher highs and higher lows. SPY is now at first support, which stems from broken resistance. The last zigzag low marks key support at 194.
**************************************************************
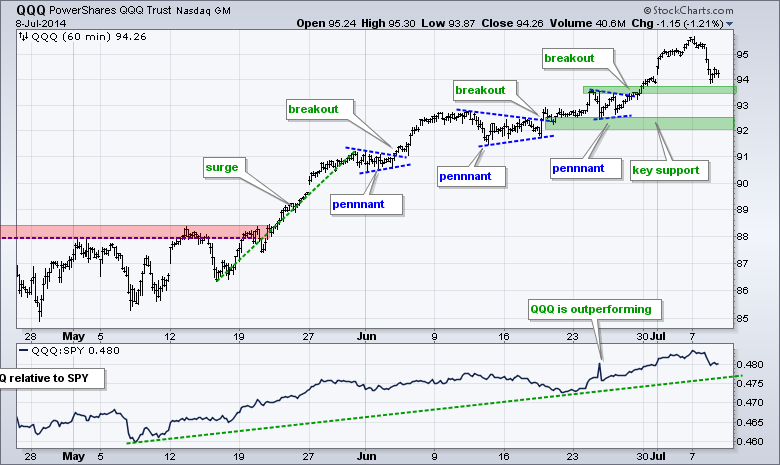
QQQ hit a new high above 95 and then fell towards the first support zone in the 92.5 area. The overall trend remains up as the ETF continues to forge higher highs and higher lows. The last pennant breakout marks first support. The late June lows mark key support. The indicator window shows the QQQ:SPY ratio falling back, but it remains in an uptrend overall and QQQ remains relatively strong.
**************************************************************
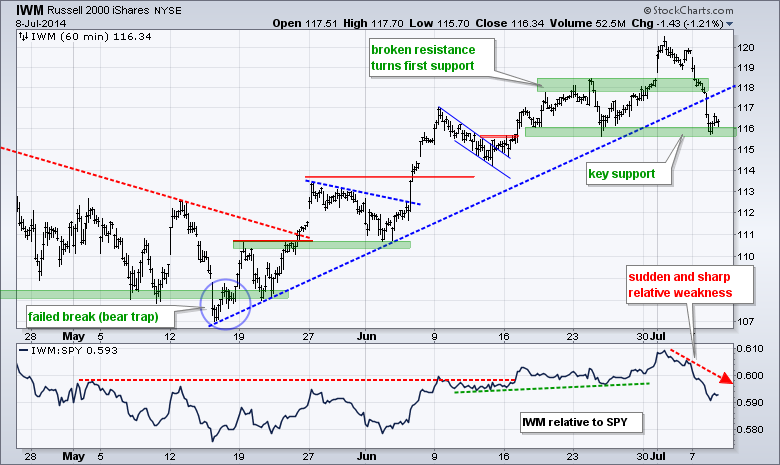
IWM surged above 120 last week and then fell sharply with a move to 116 this week. The ETF failed to hold broken resistance and broke the mid May trend line. IWM is now at key support from the late June reaction low. A move below this low would forge a lower low and reverse the short-term uptrend. The indicator window shows the IWM:SPY ratio moving sharply lower this month as small-caps underperform large-caps.
**************************************************************
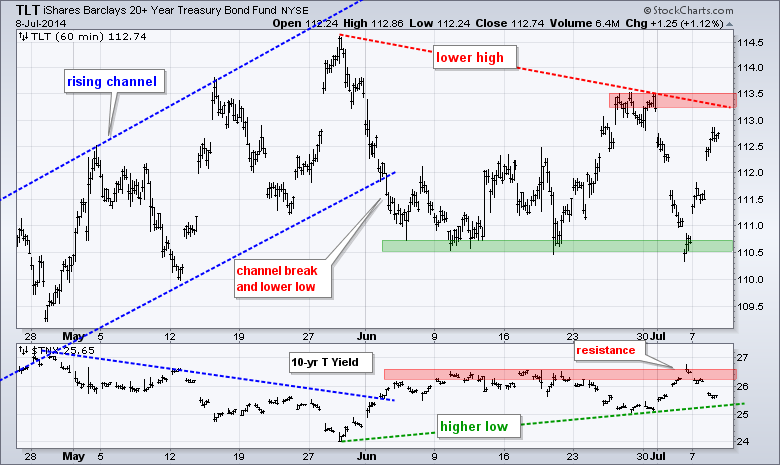
Treasuries caught a big bid as money moved from stocks to relative safety. TLT bounced off the support zone in the 110.5 area for the third time since early June. Technically, the trend since early June is still down because of the lower high in late June. A break above 113.5 would forge a higher high and reverse this downtrend. A breakout in Treasuries would likely occur if we see more selling pressure in stocks.
**************************************************************
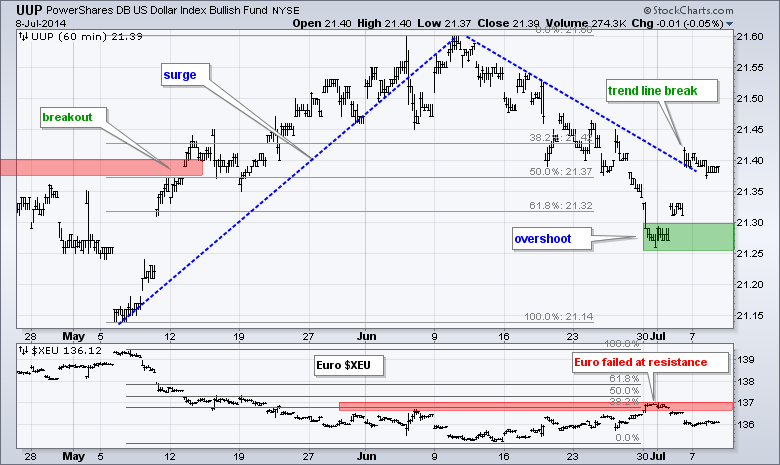
UUP broke the early June trend line with a surge last week and then stalled the last few days. The trend line break is holding, but rising bond prices and lower yields could put downward pressure on the greenback. In particular, I am watching the Euro for a breakout at 137. Such a move would be Dollar bearish and Euro bullish.
**************************************************************
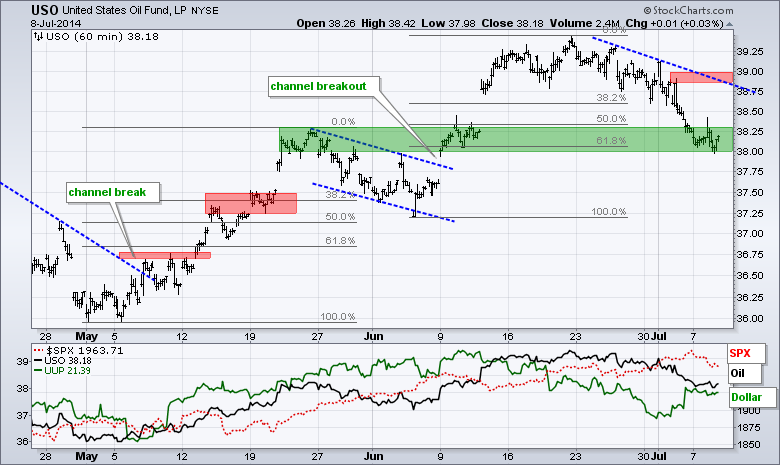
No change. USO remains in an uptrend and the current decline to 38.25 is viewed as a correction. Even though the falling flag shape is gone, the decline is in the 50-62% retracement zone and there is potential support from broken resistance. A move above 39 would signal an end to the decline and a resumption of the overall uptrend. Fundamentally, note that Iraq is in a stalemate as all sides consolidate their positions. This has taken away the war premium. The Dollar surged the last few days and this could weigh on oil. The economy and labor markets are strengthening and this could increase demand.
**************************************************************
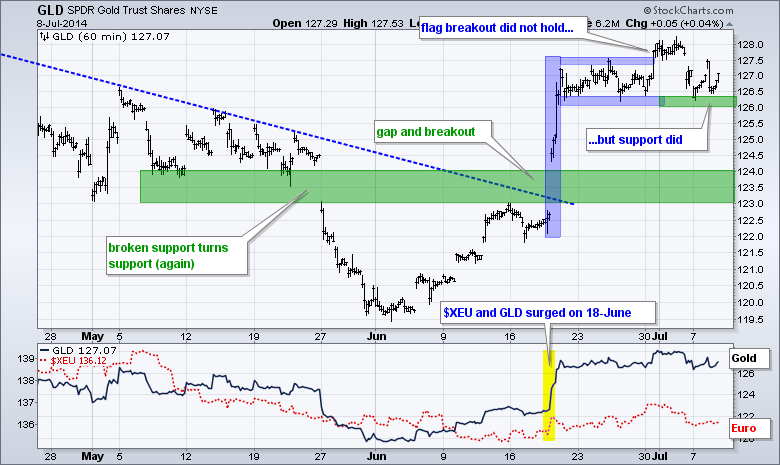
GLD broke flag resistance last week, but did not hold the breakout and fell back to support in the 126 area. GLD got a bounce in afternoon trading on Tuesday and it looks like support is holding. Further weakness in momentum stocks could push money into alternatives and gold might benefit. A move below 126 would break support and suggest that this benefit is not occurring.
***************************************************************
Key Reports and Events (all times Eastern):
Wed - Jul 09 - 07:00 - MBA Mortgage Index
Wed - Jul 09 - 10:30 - Crude Inventories
Wed - Jul 09 - 14:00 - FOMC Minutes
Thu - Jul 10 - 10:00 - Wholesale Inventories
Thu - Jul 10 - 10:30 - Natural Gas Inventories
This commentary and charts-of-interest are designed to stimulate thinking. This analysis is not a recommendation to buy, sell, hold or sell short any security (stock ETF or otherwise). We all need to think for ourselves when it comes to trading our own accounts. First, it is the only way to really learn. Second, we are the only ones responsible for our decisions. Think of these charts as food for further analysis. Before making a trade, it is important to have a plan. Plan the trade and trade the plan. Among other things, this includes setting a trigger level, a target area and a stop-loss level. It is also important to plan for three possible price movements: advance, decline or sideways. Have a plan for all three scenarios BEFORE making the trade. Consider possible holding times. And finally, look at overall market conditions and sector/industry performance.


