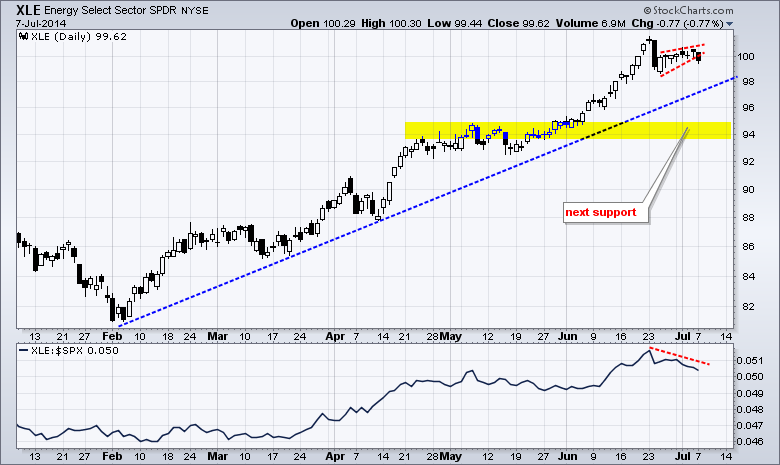
After hitting new highs last week, stocks started this week with some selling pressure. Large-caps held up relatively well as SPY fell .76%. Small-caps and micro-caps bore the brunt of selling pressure as the Russell 2000 iShares and Russell MicroCap iShares fell more than 1.5% on the day. Six of the nine sectors were down. The Technology SPDR bucked the selling pressure with a fractional gain. The Utilities SPDR and Consumer Staples SPDR gained as money moved into defense for a day. The Home Construction iShares and Retail SPDR got hammered with 1+ percent losses. Energy stocks were hit even harder as the Oil & Gas Equip & Services SPDR and Oil & Gas E&P SPDR lost more than 1.5%. The Energy SPDR (XLE) is the top performing sector over the last three months, but the ETF shows some relative weakness over the last few weeks. XLE did not exceed its late June high and the price relative (XLE:SPY ratio) turned down in late June. These developments are not long-term or even medium-term bearish, but the ETF does look vulnerable to some short-term weakness. XLE broke the wedge trend line and this could signal the start of a correction towards the mid 90s.
**This chart analysis is for educational purposes only, and should not
be construed as a recommendation to buy, sell or sell-short said securities**
**************************************************************
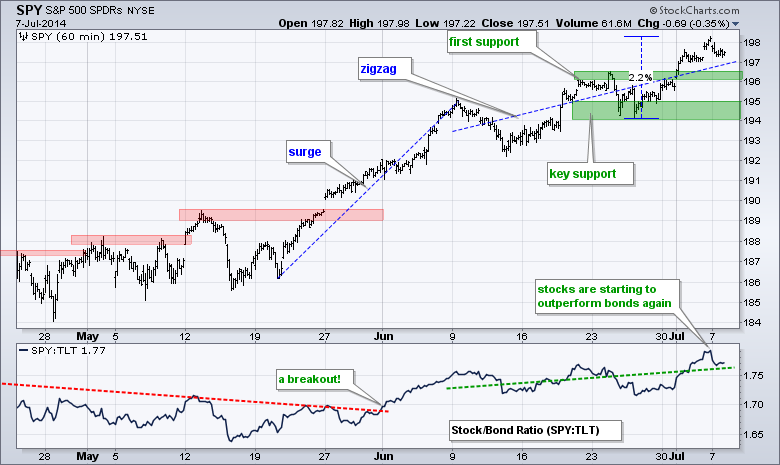
No change. SPY extended its uptrend with a 2.2% surge and another new high. SPY is now up 10% from its mid April low and 15% from its early February low. Broken resistance turns first support in the 196-196.5 area. The late June lows mark key support in the 195-196 area. Stocks resumed their outperformance of bond as the SPY:TLT ratio surged above its June high. Relative strength in stocks is positive overall.
**************************************************************
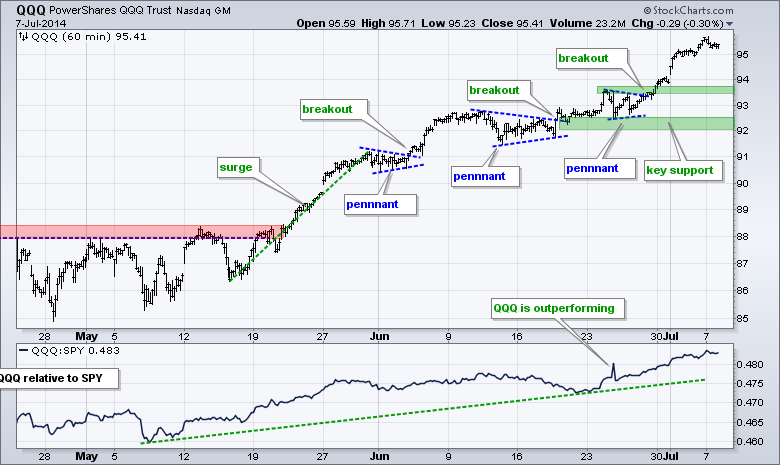
No change. QQQ made it three for three with a pennant breakout in late June and surge to new highs in early July. The ETF is up around 3% the last six days and leading SPY. Broken resistance turns first support in the 93.5 area. The pennant lows and a buffer mark key support in the 92-92.5 area.
**************************************************************
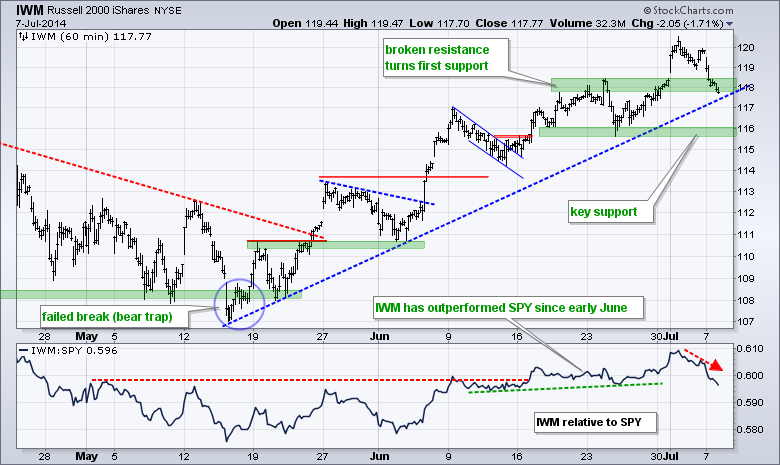
No change. IWM surged to a new high the first day of July and then fell back over the last few days. The rally may seem long in tooth, but the overall trend is up as IWM challenges its March high. Broken resistance turns first support in the 118 area. The late June lows mark key support in the 115.5-116 area. The indicator window shows the IWM:SPY ratio surging in early June and then edging higher the last four weeks. Relative strength is not overwhelming, but small-caps are outperforming large-caps the last five weeks.
**************************************************************
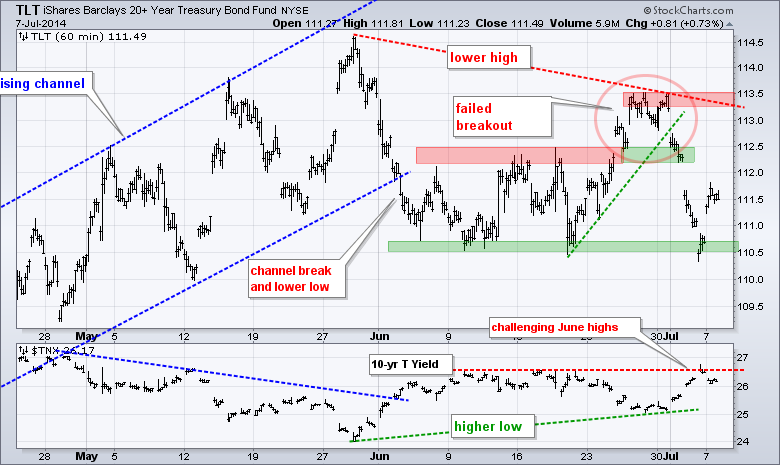
No change. TLT failed to hold its breakout and plunged to the June lows with a sharp decline last week. Strength in the labor market and modest inflationary pressures are putting fear into the bond market. TLT has now formed a lower high after the early June channel break. It looks like a downtrend is underway in TLT and an uptrend is starting in the 10-YR Treasury Yield ($TNX). Broken resistance from the February-March highs marks next support in the 108 area.
**************************************************************
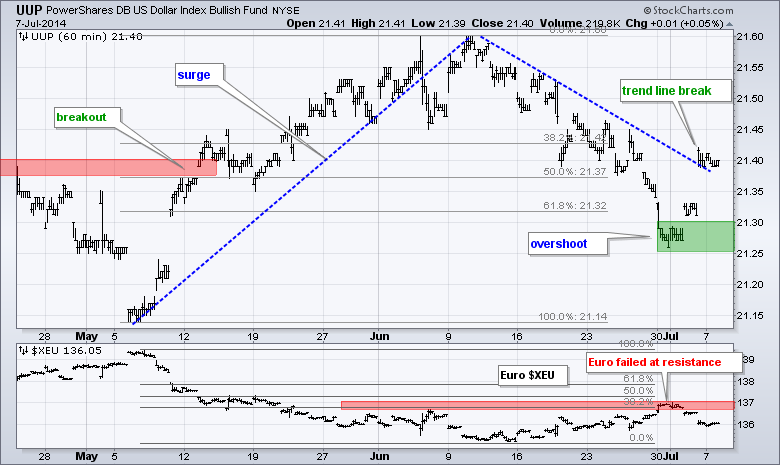
No change. UUP got a bounce as the Euro fell from resistance and the Yen broke the June trend line. The prospect of higher Treasury yields is positive for the Dollar. Moreover, weakness in the Eurozone economy is negative for the Euro. UUP overshot its 62% retracement, but the Euro hit resistance near the 38% retracement and fell sharply the last two days. UUP deserves a bullish bias as long as the Euro gets a bearish bias. The Euro Index ($XEU) is bearish as long as 137 holds.
**************************************************************
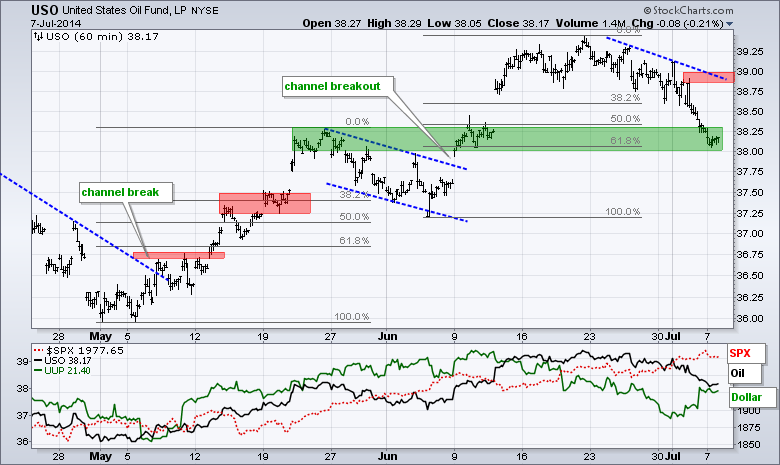
No change. USO remains in an uptrend and the current decline to 38.25 is viewed as a correction. Even though the falling flag shape is gone, the decline is in the 50-62% retracement zone and there is potential support from broken resistance. A move above 39 would signal an end to the decline and a resumption of the overall uptrend. Fundamentally, note that Iraq is in a stalemate as all sides consolidate their positions. This has taken away the war premium. The Dollar surged the last few days and this could weigh on oil. The economy and labor markets are strengthening and this could increase demand.
**************************************************************
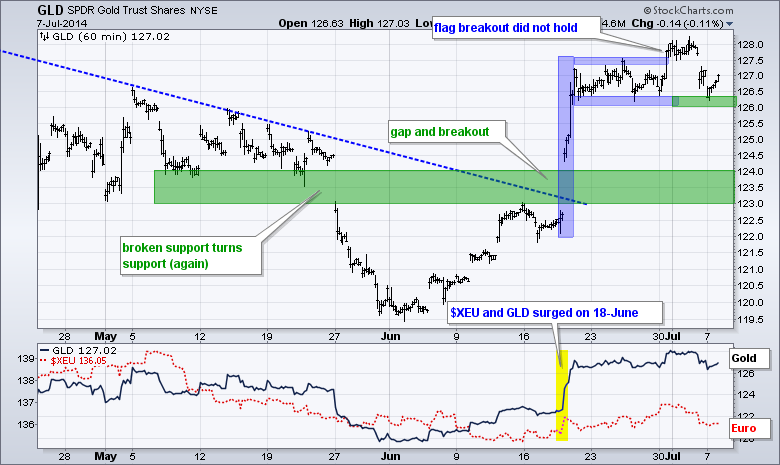
No change. GLD surged in mid June with a big move above 126. This move coincided with a surge in the Euro, a drop in the Dollar and a refinery attack by ISIS in Iraq. Oil surged the prior week and gold found a reason to play catch up. GLD then consolidated with a flat flag and broke flag resistance. This breakout, however, did not hold as GLD fell back below 127.5. This failed breakout is the first negative. A follow thru break below flag support at 126 would be short-term bearish. A further stalemate in Iraq and strength in the greenback could trigger such a break.
***************************************************************
Key Reports and Events (all times Eastern):
Tue - Jul 08 - 10:00 - JOLTS - Job Openings
Tue - Jul 08 - 15:00 - Consumer Credit
Wed - Jul 09 - 07:00 - MBA Mortgage Index
Wed - Jul 09 - 10:30 - Crude Inventories
Wed - Jul 09 - 14:00 - FOMC Minutes
Thu - Jul 10 - 10:00 - Wholesale Inventories
Thu - Jul 10 - 10:30 - Natural Gas Inventories
This commentary and charts-of-interest are designed to stimulate thinking. This analysis is not a recommendation to buy, sell, hold or sell short any security (stock ETF or otherwise). We all need to think for ourselves when it comes to trading our own accounts. First, it is the only way to really learn. Second, we are the only ones responsible for our decisions. Think of these charts as food for further analysis. Before making a trade, it is important to have a plan. Plan the trade and trade the plan. Among other things, this includes setting a trigger level, a target area and a stop-loss level. It is also important to plan for three possible price movements: advance, decline or sideways. Have a plan for all three scenarios BEFORE making the trade. Consider possible holding times. And finally, look at overall market conditions and sector/industry performance.


