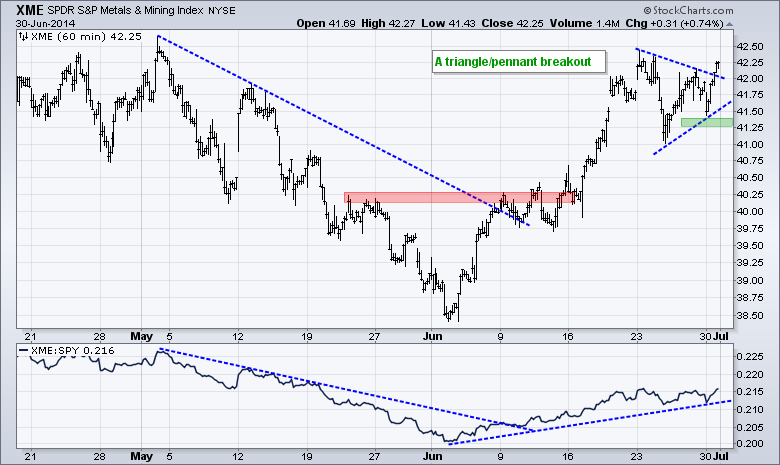
Stocks were again mixed on Monday. Large-caps lagged as the Dow Diamonds and S&P 500 SPDR closed fractionally lower. Small-caps led as the Russell 2000 iShares closed near last week's high. Techs also showed some relative strength as the Nasdaq 100 ETF hit another new high. The materials and energy sectors were strong. Materials got a lift from copper, gold and steel related stocks. Oil services, oil equipment and natural gas stocks lifted the energy sector. The chart below shows 60-minute bars for the Metals & Miners SPDR (XME). After a breakout in mid June, the ETF surged and formed a triangle, which would be a pennant on the daily chart. XME broke pennant resistance with a move above 42 and chartists can mark support at 41.25.
**This chart analysis is for educational purposes only, and should not
be construed as a recommendation to buy, sell or sell-short said securities**
*************************************************************
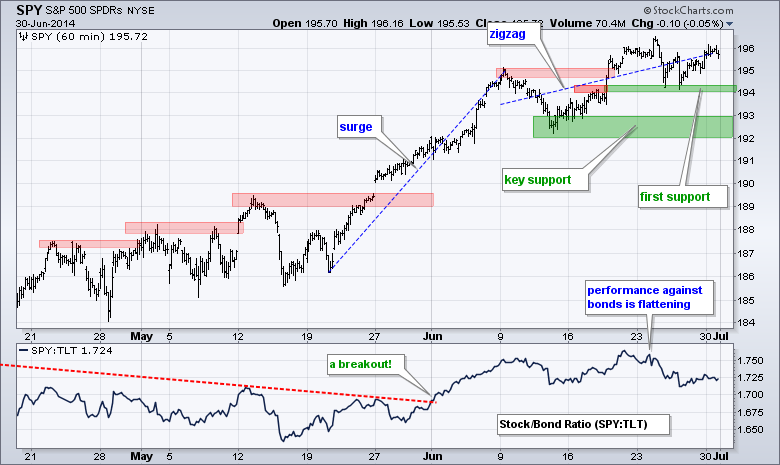
No change. The short-term trend for SPY remains up, but the advance slowed a little as trading turned choppy the last three weeks. Notice how SPY surged from late May to early June. There was a correction the second week of June and the ETF then moved to a new high last week (above 196). The advance may be slowing, but it is still an advance. Last week's lows mark first support in the 194 area. The mid June lows mark key support in the 192-193 area.
**************************************************************
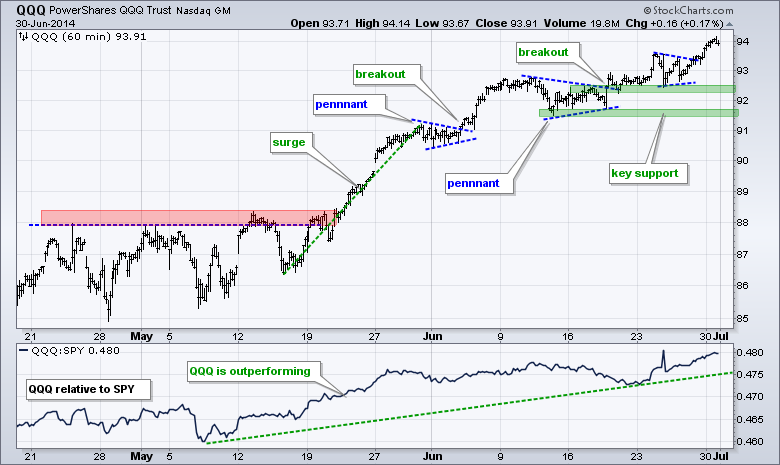
No change. QQQ surged at the end of May and extended its advance in June with a choppier pattern. Three pennants formed and QQQ broke out three times. The most recent breakout occurred on Friday as the ETF finished at a new high. Broken resistance and last week's lows combine to mark first support in the 92.5 area. The mid June lows mark key support in the 91.50 area.
**************************************************************
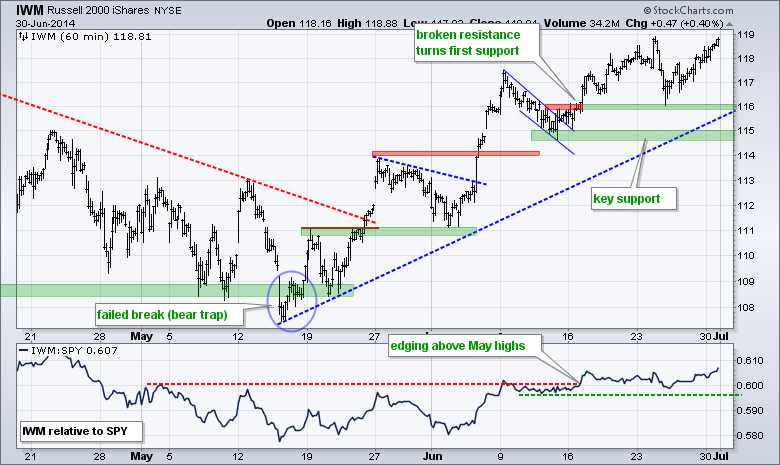
No change. IWM remains in a short-term uptrend and hit a new high near 119 early last week. Even though the ETF reversed after this new high, the flag breakout turned into support and held near 116. This is now the first level to watch for signs of weakness. I will set key support in the 114.5-115 area. A break below this zone would fully reverse the short-term uptrend.
**************************************************************
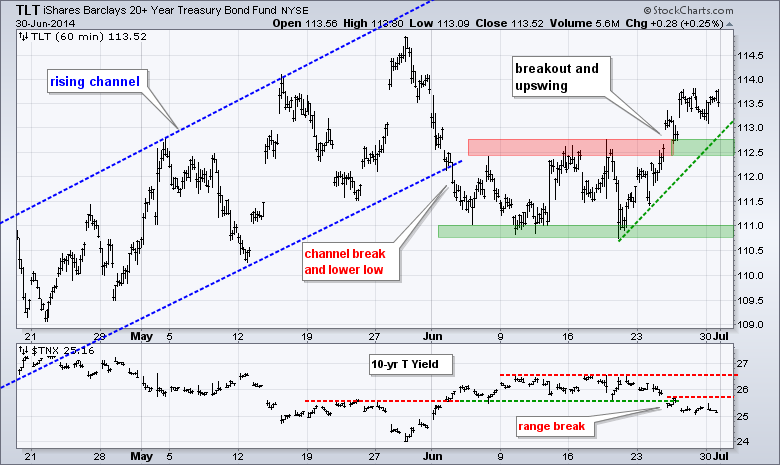
No change. TLT held support in the 111 area and then surged above resistance to reverse the short-term downtrend. Broken resistance turns first support at 112.5, and this level also marks upswing support. A quick move below 112.5 would negate this breakout. The June lows mark key support in the 110.7-111 area. The 10-YR Treasury Yield ($TNX) broke support last week to confirm the upside breakout in TLT.
**************************************************************
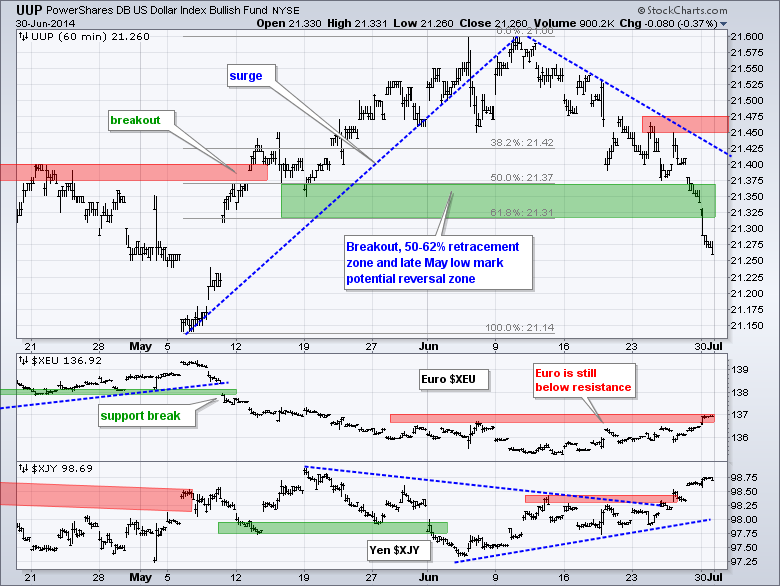
UUP simply fell apart as the Euro surged to resistance and the Yen moved to its highest level of the month (June). UUP did not hold the retracement zone and did not hold the breakout in mid May. Boo hiss. The late June highs mark resistance in the 21.45-21.475 area.
**************************************************************
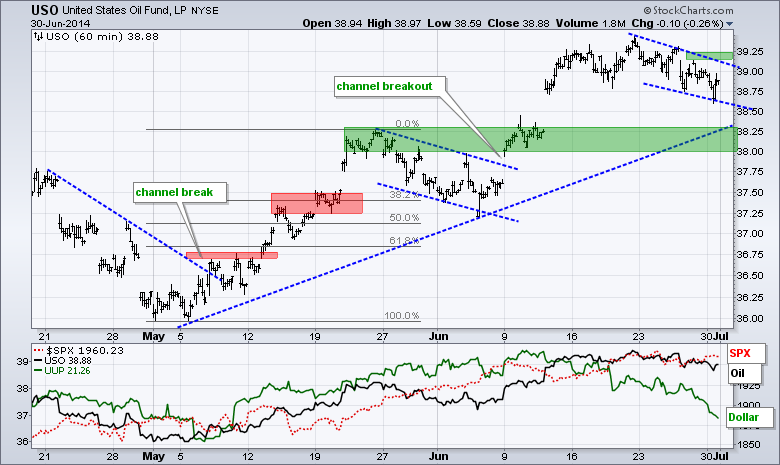
USO surged on the Iraq situation and then fell back over the past week. The decline looks like a falling flag of sorts and a break above 39.25 would signal a continuation of the June surge. The early May trend line and broken resistance mark key support in the 38-38.25 area.
**************************************************************
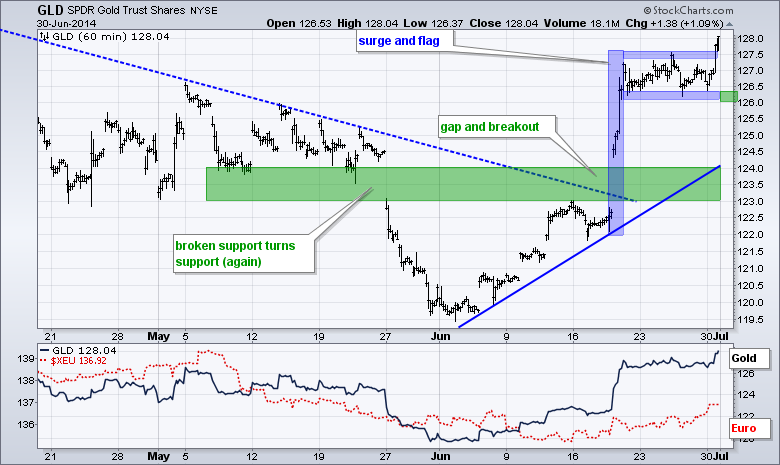
GLD surged and then consolidated with a flat flag. The ETF got a lift from the uncertainty in Iraq and a bounce in the Euro in mid June. Iraq may be turning into a stalemate, but the Euro continued higher and the Dollar plunged over the last few days. GLD broke flag resistance and this signals a continuation of the prior advance. Chartists can mark first support at 126.
***************************************************************
Key Reports and Events (all times Eastern):
Tue - Jul 01 - 10:00 - ISM Manufacturing Index
Tue - Jul 01 - 10:00 - Construction Spending
Tue - Jul 01 - 14:00 - Auto Sales/Truck Sales
Wed - Jul 02 - 07:00 - MBA Mortgage Index
Wed - Jul 02 - 07:30 - Challenger Job Report
Wed - Jul 02 - 08:15 - ADP Employment Report
Wed - Jul 02 - 10:00 - Factory Orders
Wed - Jul 02 - 10:30 - Crude Oil Inventories
Thu - Jul 03 - 08:30 - Employment Report
Thu - Jul 03 - 10:00 - ISM Services Index
Thu - Jul 03 - 10:30 - Natural Gas Inventories
This commentary and charts-of-interest are designed to stimulate thinking. This analysis is not a recommendation to buy, sell, hold or sell short any security (stock ETF or otherwise). We all need to think for ourselves when it comes to trading our own accounts. First, it is the only way to really learn. Second, we are the only ones responsible for our decisions. Think of these charts as food for further analysis. Before making a trade, it is important to have a plan. Plan the trade and trade the plan. Among other things, this includes setting a trigger level, a target area and a stop-loss level. It is also important to plan for three possible price movements: advance, decline or sideways. Have a plan for all three scenarios BEFORE making the trade. Consider possible holding times. And finally, look at overall market conditions and sector/industry performance.


