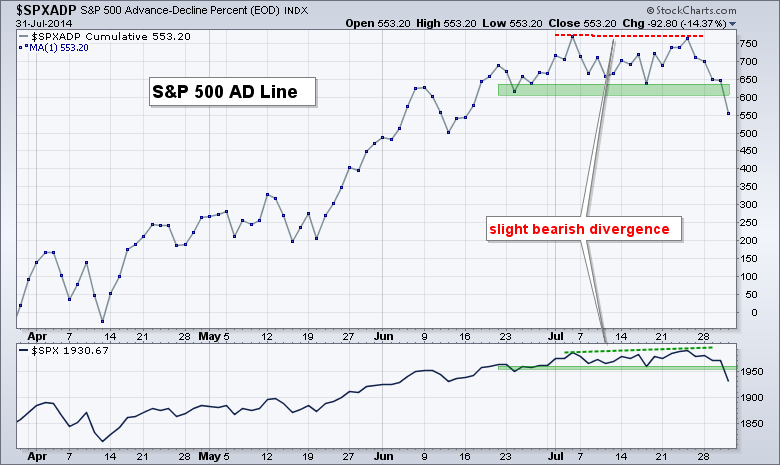
Stocks were hit with broad selling pressure on Thursday as the major index ETFs opened weak and remained weak throughout the day. The inability to bounce indicates that buyers remained on the sidelines and did not step in to buy the dip. All sectors were down as were all 105 Dow Jones industry groups. Yes, there was no place to hide. The chart below shows the S&P 500 AD Line ($SPXADP) breaking a support zone that extends back to late June. Also notice that the indicator formed a slight bearish divergence. The AD Line formed a lower high in late July as the S&P 500 formed a higher high. Breadth did not keep up in late July and the break down is short-term bearish. Note that both the AD Line and S&P 500 reversed short-term uptrends that started way back in mid April.
**This chart analysis is for educational purposes only, and should not
be construed as a recommendation to buy, sell or sell-short said securities**
*************************************************************
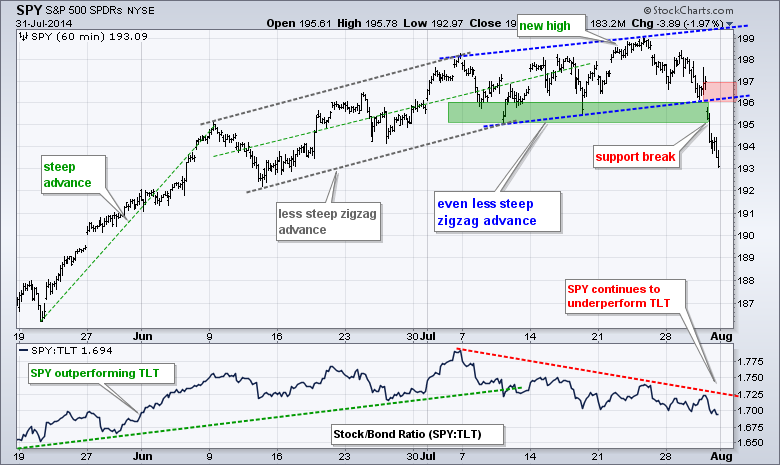
SPY broke channel support and the July lows with a sharp decline that wiped out all of the month's gains. This decline reverses the short-term uptrend and suggest that perhaps a deeper correction will unfold. Broken support and a buffer mark first resistance in the 196-197 area.
**************************************************************
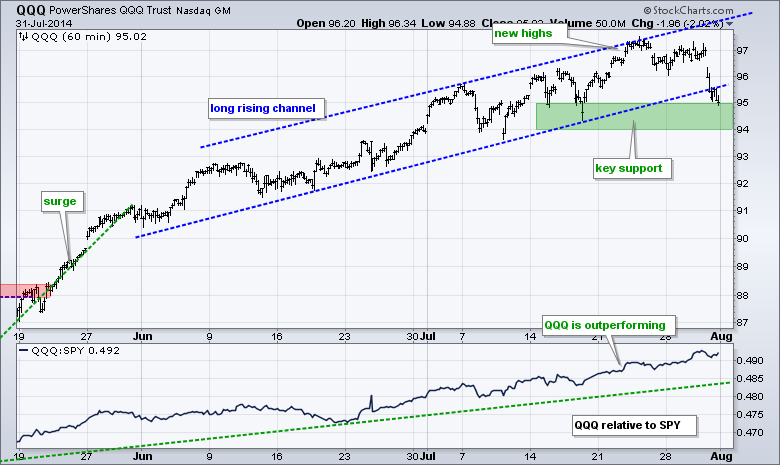
QQQ gapped down and fell below the lower trend line of the rising channel. The ETF is, however, at the top of a support zone marked by the mid July low.
**************************************************************
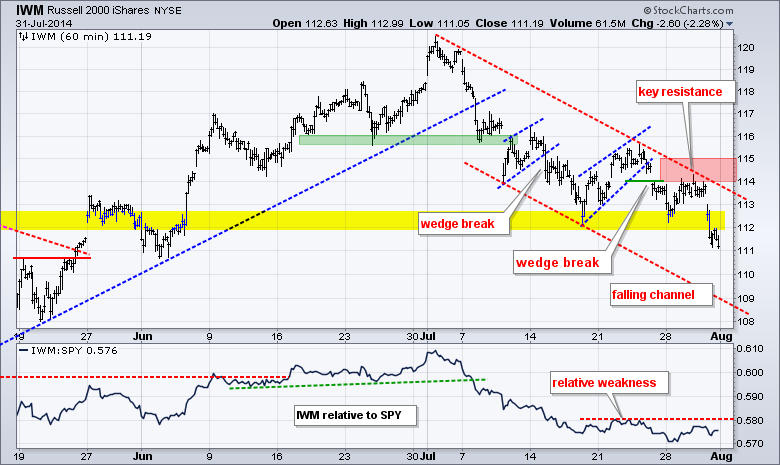
IWM failed near the upper trend line of the falling channel and declined below 112 with a sharp decline. The channel remains in force and defines the current downtrend. The upper trend line and a buffer mark key resistance in the 114-115 area. The lower trend line marks a potential target in the 108-109 area.
**************************************************************
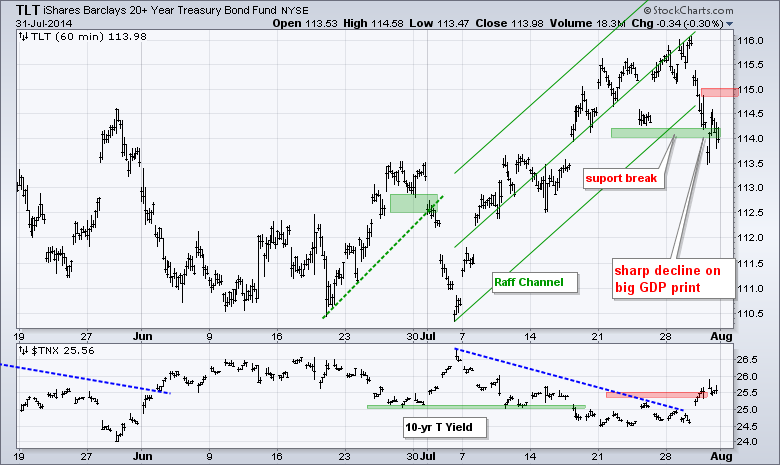
TLT did not surge or bounce as the stock market fell. This suggests that sentiment may be changing in the bond market. On the price chart, TLT broke support at 114 and I am going to mark first resistance at 115. The indicator window shows the 10-YR Treasury Yield ($TNX) breaking above resistance in the 25.5 area (2.55%).
**************************************************************
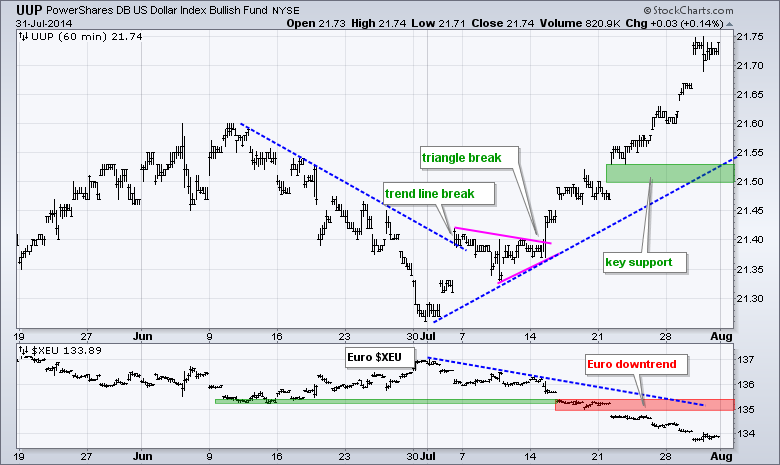
UUP remains in a strong uptrend and $XEU remains in a strong downtrend. The moves may be getting extended, but pullbacks would be viewed as corrections within the uptrend. Key support for UUP is set at 21.50 and key resistance for $XEU is set at 135.50.
**************************************************************
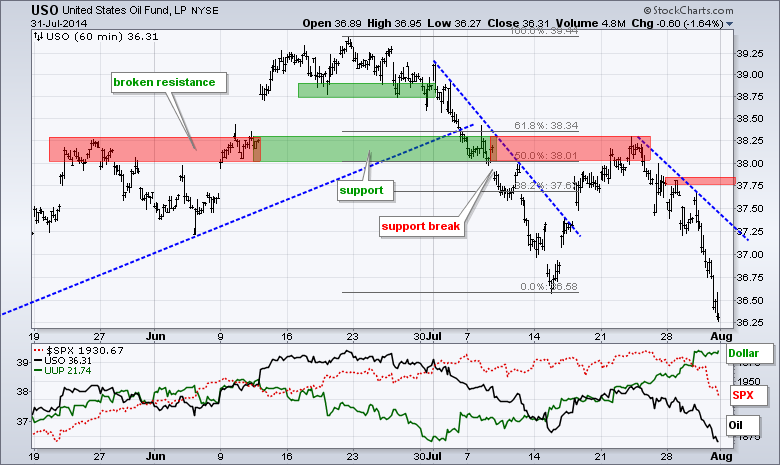
A strong Dollar, weak stock market and fracking fever weighed on oil as USO plunged below its mid July low. The ETF is getting a little oversold after the sharp decline, but the trend is clearly down here. I will keep resistance in the 37.75 area for now.
**************************************************************
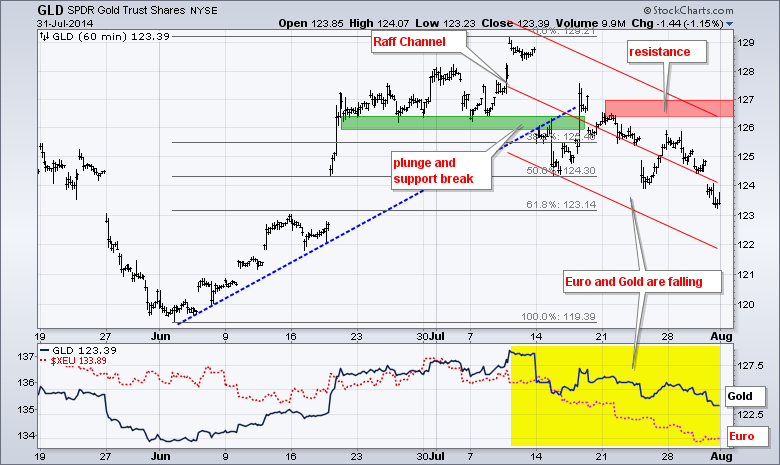
Gold failed to rise even though stocks fell apart and Argentina defaulted. A strong Dollar appears to be weighing more on bullion. With a new low for the month, I extended the Raff Regression Channel in GLD and will lower key resistance to 127. GLD is at the 62% retracement mark, but shows no signs of strength and the immediate trend is clearly down.
***************************************************************
Key Reports and Events (all times Eastern):
Fri - Aug 01 - 08:30 - Employment Report
Fri - Aug 01 - 08:30 - Personal Income & Spending
Fri - Aug 01 - 08:30 - PCE Prices
Fri - Aug 01 - 09:55 - Michigan Sentiment
Fri - Aug 01 - 10:00 - ISM Index
Fri - Aug 01 - 10:00 - Construction Spending
Fri - Aug 01 - 14:00 - Auto/Truck Sales
This commentary and charts-of-interest are designed to stimulate thinking. This analysis is not a recommendation to buy, sell, hold or sell short any security (stock ETF or otherwise). We all need to think for ourselves when it comes to trading our own accounts. First, it is the only way to really learn. Second, we are the only ones responsible for our decisions. Think of these charts as food for further analysis. Before making a trade, it is important to have a plan. Plan the trade and trade the plan. Among other things, this includes setting a trigger level, a target area and a stop-loss level. It is also important to plan for three possible price movements: advance, decline or sideways. Have a plan for all three scenarios BEFORE making the trade. Consider possible holding times. And finally, look at overall market conditions and sector/industry performance.


