There are no real changes in the trends so I just updated the charts.
**This chart analysis is for educational purposes only, and should not
be construed as a recommendation to buy, sell or sell-short said securities**
**************************************************************
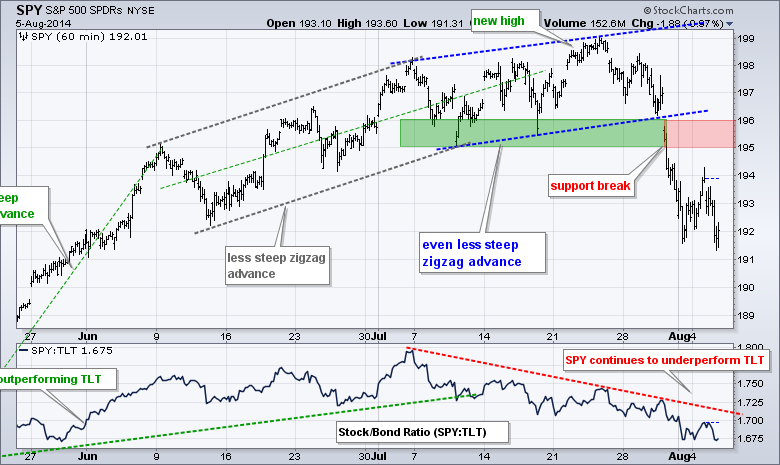
SPY remains in a short-term downtrend after the support break in the 195-196 area. At this point, the ETF needs to negate the support break to get the short-term uptrend back. I will, therefore, set key resistance at 196. The indicator window shows SPY underperforming TLT and this is negative for the stock market.
**************************************************************
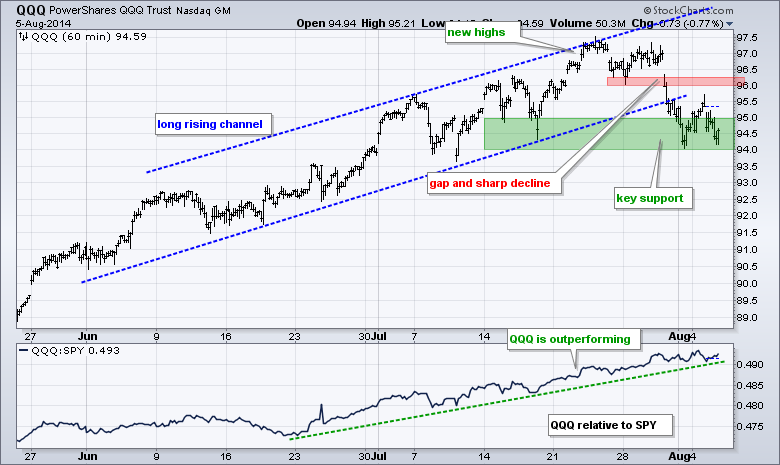
QQQ bounced off the support zone, but remains with the gap down and minor support break from last week. QQQ is a hard call because IWM and SPY are in short-term downtrends, which means they may ultimately weigh on QQQ. Broken support and the gap mark first resistance to watch.
**************************************************************
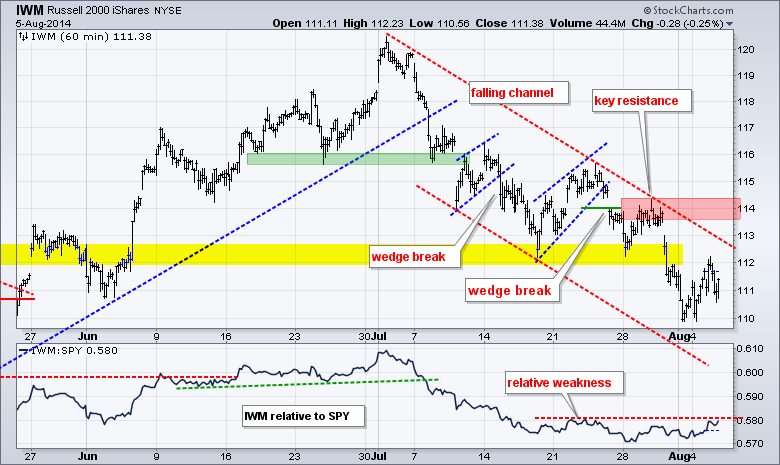
IWM got a pretty nice bounce on Monday, but the overall downtrend remains and the ETF continues to show relative weakness. At this point, IWM needs to break the early July trend line and exceed the late July high to fully reverse the downtrend. The indicator window shows the price relative flattening out the last few weeks. Even though relative weakness has slowed, a break above the red line is needed to show a return to relative strength.
**************************************************************
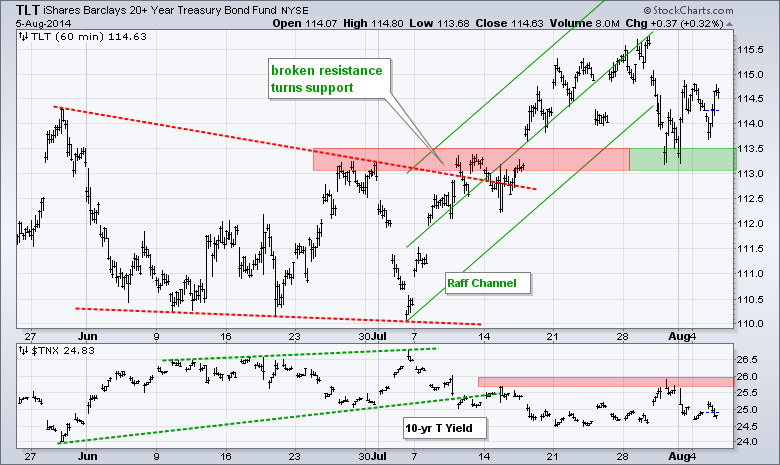
TLT remains a tough call. Overall, the ETF broke out with a big move in July and broken resistance turned into support in the 113-113.5 area. TLT broke the Raff Regression Channel, but rebounded almost immediately. I will, therefore, set support at 113 and watch this level for a break that would reverse the current upswing.
**************************************************************
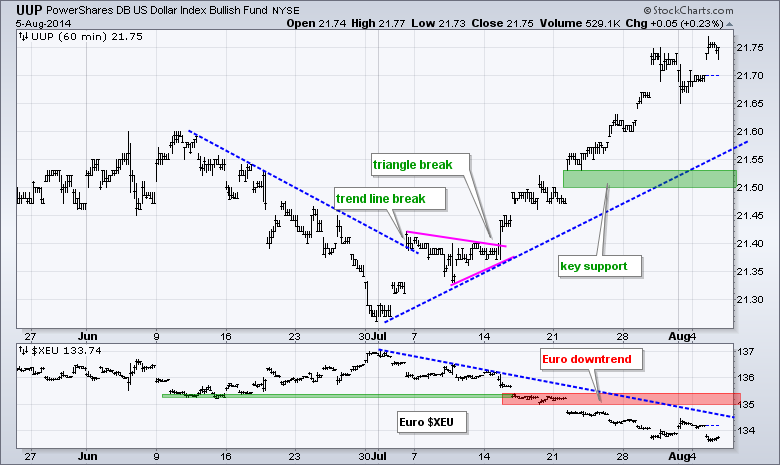
UUP remains in a strong uptrend and $XEU remains in a strong downtrend. The moves may be getting extended, but pullbacks would be viewed as corrections within the uptrend. Key support for UUP is set at 21.50 and key resistance for $XEU is set at 135.50.
**************************************************************
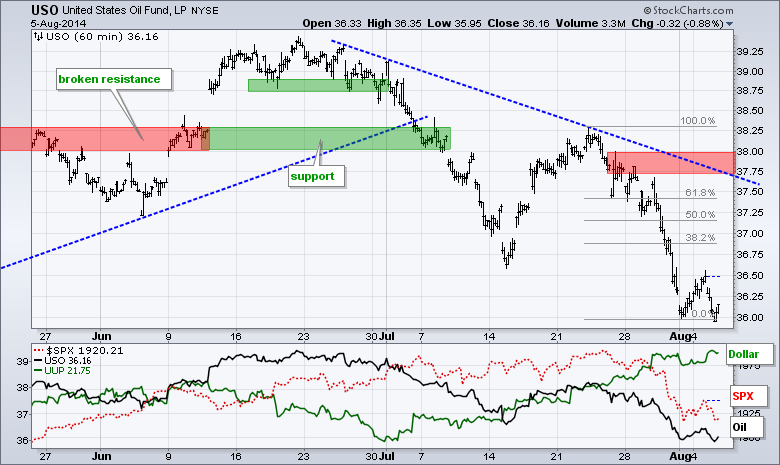
USO became way oversold with a plunge from 38.25 to 36 and got an oversold bounce on Friday-Monday. At this point, we could see a move that retraces around half the prior decline. The late June trend line and mid July high combine to mark key resistance in the 37.75-38 area.
**************************************************************
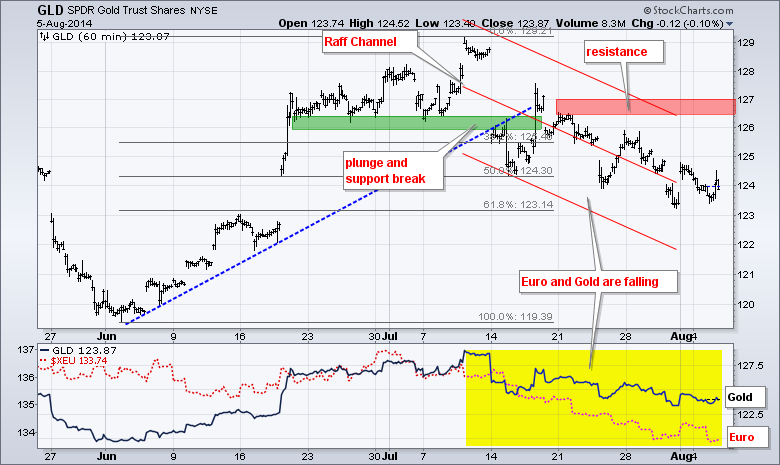
GLD remains in short-term downtrend that could be corrective because ETF bounced off the 62% retracement. However, there was no follow thru to Friday's bounce and no breakout. The Raff Regression Channel, late July highs and a buffer mark resistance at 127. Watch this level for the follow through breakout.
***************************************************************
Key Reports and Events (all times Eastern):
Tue - Aug 05 - 10:00 - ISM Non-Manufacturing Index
Tue - Aug 05 - 10:00 - Factory Orders
Wed - Aug 06 - 07:00 - MBA Mortgage Index
Wed - Aug 06 - 10:30 - Crude Oil Inventories
Thu - Aug 07 - 08:30 - Initial Jobless Claims
Fri - Aug 08 - 08:00 - ChartCon
This commentary and charts-of-interest are designed to stimulate thinking. This analysis is not a recommendation to buy, sell, hold or sell short any security (stock ETF or otherwise). We all need to think for ourselves when it comes to trading our own accounts. First, it is the only way to really learn. Second, we are the only ones responsible for our decisions. Think of these charts as food for further analysis. Before making a trade, it is important to have a plan. Plan the trade and trade the plan. Among other things, this includes setting a trigger level, a target area and a stop-loss level. It is also important to plan for three possible price movements: advance, decline or sideways. Have a plan for all three scenarios BEFORE making the trade. Consider possible holding times. And finally, look at overall market conditions and sector/industry performance.


