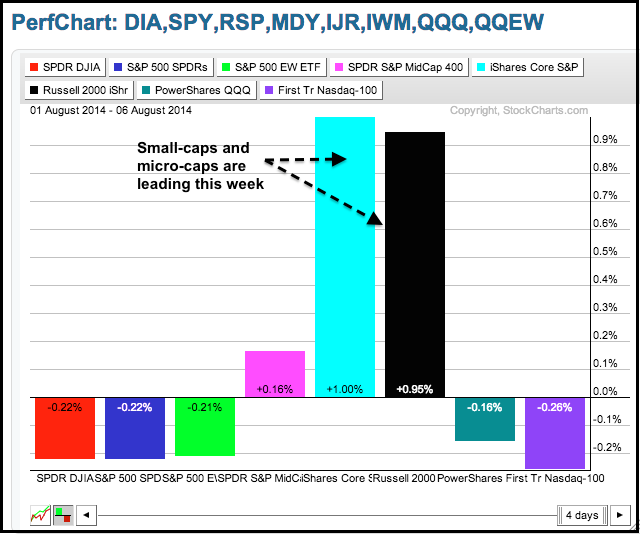
Stocks were mixed on Wednesday, but small-caps and micro-caps are starting to show some relative strength. The PerfChart below shows the performance for eight major index ETFs this week. IWM and IWC are up around 1% and leading the pack. MDY is the only other one showing a gain. SPY, DIA, RSP, QQQ and QQEW are down. It is still a bit soon to consider this lasting change in relative performance, but it is a start and chartists should watch the IWM chart for a potential channel breakout.
**This chart analysis is for educational purposes only, and should not
be construed as a recommendation to buy, sell or sell-short said securities**
**************************************************************
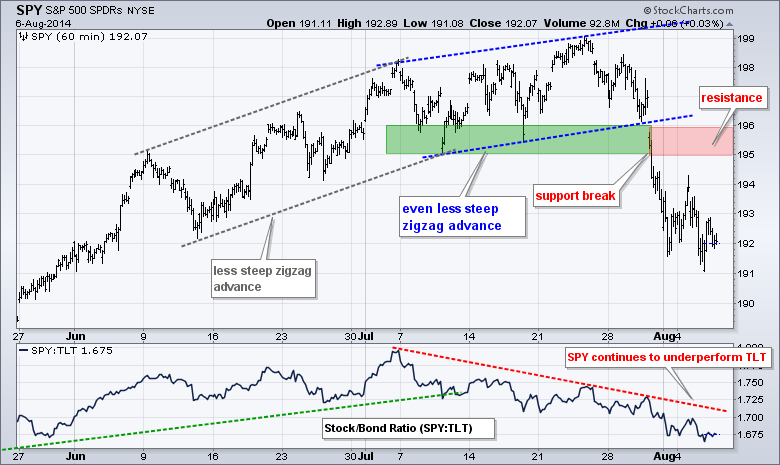
SPY broke down with a sharp decline in late July and this break down is holding as the ETF worked its way lower the last three days. Broken support turns into key resistance in the 195-196 area. The indicator window shows SPY continuing to underperform TLT, which is negative for stocks.
**************************************************************
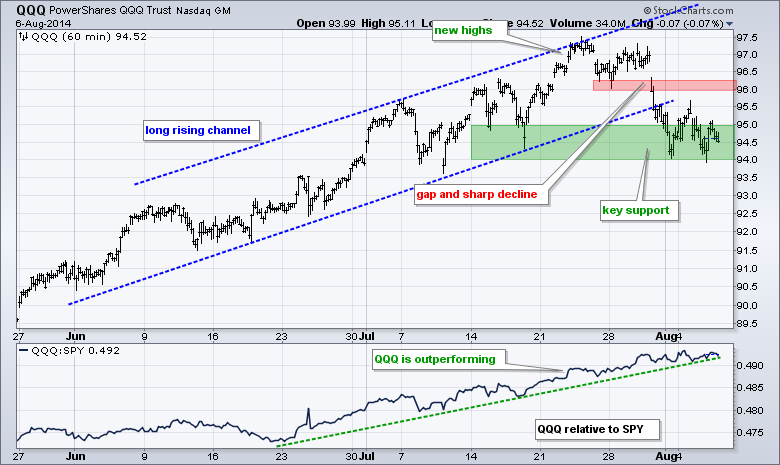
QQQ broke support near 96 and fell to the big support zone around 94-95. The ETF stalled the last three days with a consolidation of sorts. A break below 93.9 would signal a continuation lower and be short-term bearish. QQQ continues to show relative strength as the price relative rises. A break down in this leader could affect market sentiment overall.
**************************************************************
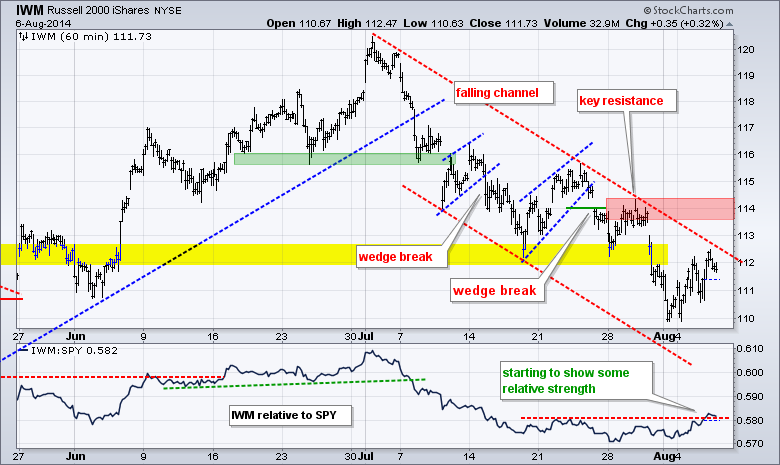
IWM remains within a falling channel and in a clear downtrend. The ETF, however, is showing some relative strength this week as the price relative (IWM:SPY ratio) moves above the late July highs. This is a start. IWM needs to exceed 113 to break the channel trend line and 114.4 to fully reverse the short-term downtrend.
**************************************************************
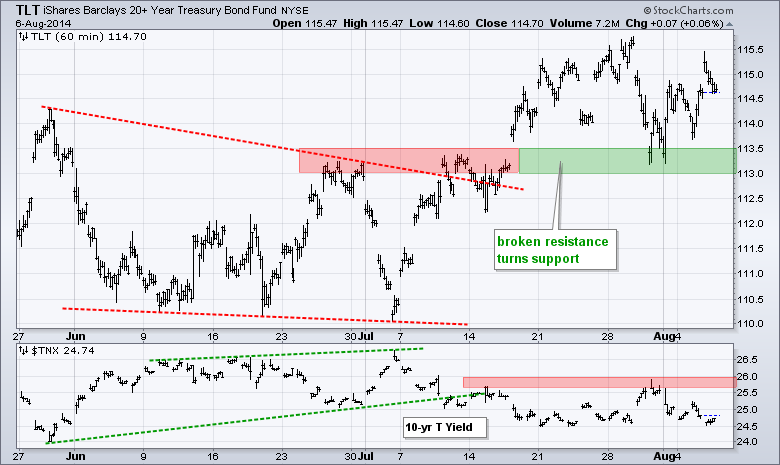
TLT refuses to stay down for long. After a sharp decline last week, the ETF held support near broken resistance and worked its way higher the last few days. This affirms support in the 113-113.5 area.
**************************************************************
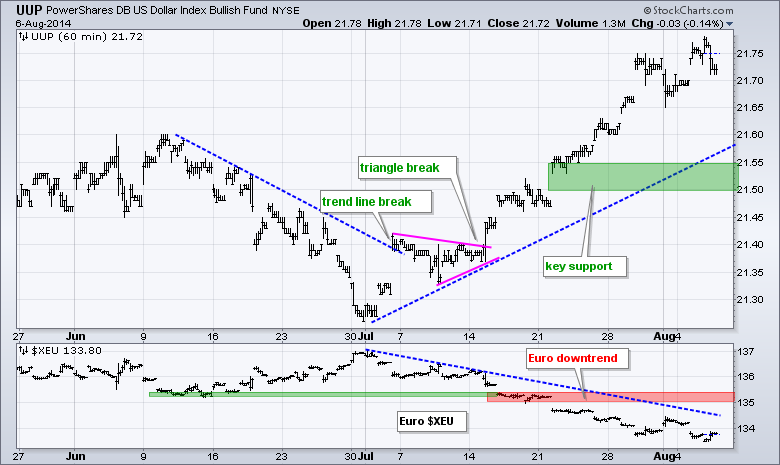
UUP remains in a strong uptrend and $XEU remains in a strong downtrend. The moves may be getting extended, but pullbacks would be viewed as corrections within the uptrend. Key support for UUP is set at 21.50 and key resistance for $XEU is set at 135.50.
**************************************************************
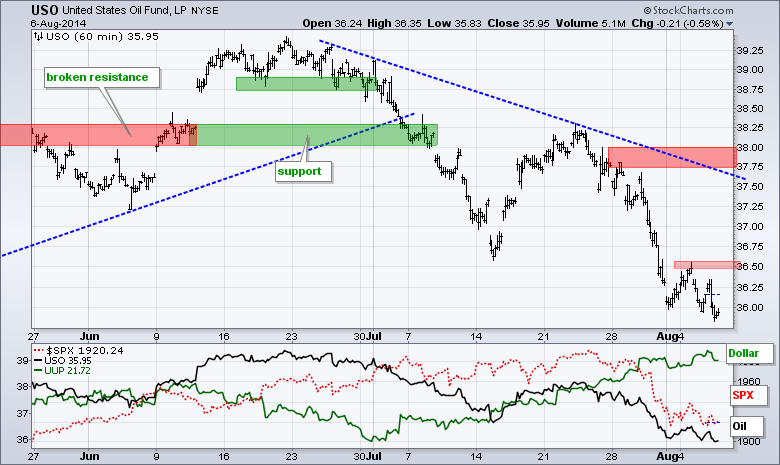
USO broke down last week and became short-term oversold near 36. The ETF got a small bounce, but fell back to 36 almost immediately. The trend here is down with this week's high marking the very first resistance level to watch. A breakout would signal the start of an oversold bounce, not a short-term uptrend. I will leave key resistance in the 37.75-38 area for now.
**************************************************************
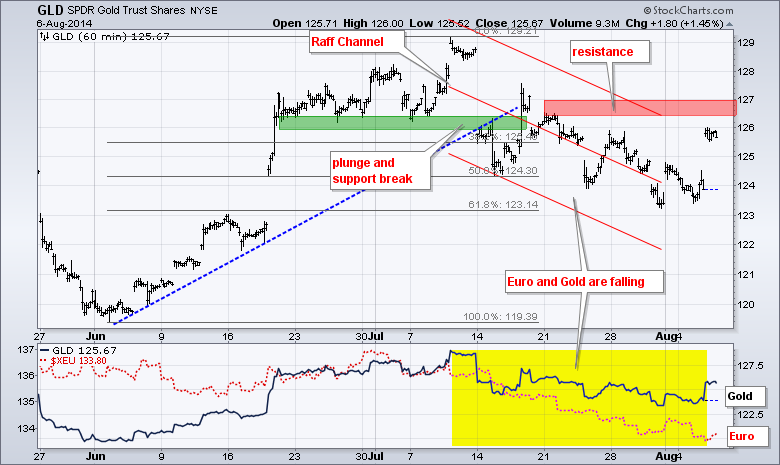
A tiny bit of Dollar weakness triggered a big bounce in bullion as GLD surged above 125. This is the first sign that the five week decline is corrective. However, the Dollar is still in an uptrend and we have yet to see a follow through breakout in GLD. Look for a break out at 127 to reverse the short-term downtrend.
***************************************************************
Key Reports and Events (all times Eastern):
Thu - Aug 07 - 08:30 - Initial Jobless Claims
Fri - Aug 08 - 08:00 - ChartCon
This commentary and charts-of-interest are designed to stimulate thinking. This analysis is not a recommendation to buy, sell, hold or sell short any security (stock ETF or otherwise). We all need to think for ourselves when it comes to trading our own accounts. First, it is the only way to really learn. Second, we are the only ones responsible for our decisions. Think of these charts as food for further analysis. Before making a trade, it is important to have a plan. Plan the trade and trade the plan. Among other things, this includes setting a trigger level, a target area and a stop-loss level. It is also important to plan for three possible price movements: advance, decline or sideways. Have a plan for all three scenarios BEFORE making the trade. Consider possible holding times. And finally, look at overall market conditions and sector/industry performance.


