Stocks followed up on Friday's gains with a strong open on Monday. There was not much follow through to this strong open, but the gains did hold for the most part. Short-term, I would say the cup is half full (bullish) until proven otherwise. A filling of Monday's gap would provide the first sign that the 2-day surge was just an oversold bounce and not the start of a short-term uptrend. On another positive note, notice that small-caps outperformed over the last six days and IWM broke out with a gap. I will be minding the gap over the next few days.
**This chart analysis is for educational purposes only, and should not
be construed as a recommendation to buy, sell or sell-short said securities**
**************************************************************
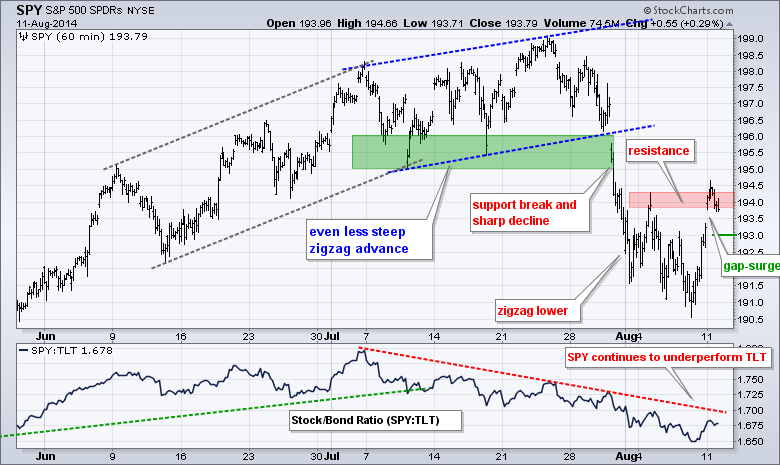
SPY followed up Friday's surge with a gap and close in the resistance zone. There was no follow through to the gap, but it did hold and should be considered positive as long as it does hold. A close in the resistance zone means SPY could still go either way. A follow thru break above Monday's high would be bullish, while a move below 193 would fill the gap and suggest a failure.
**************************************************************
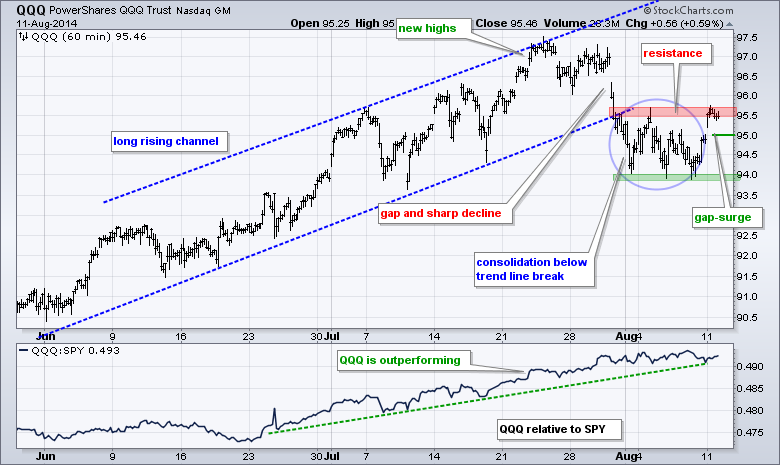
QQQ gapped up, stalled in the resistance zone and closed in this zone. As with SPY, the gap and bounce off support are positive as long as the gap holds. A move below 95.7 would negate the gap and provide the first signs that resistance will hold.
**************************************************************
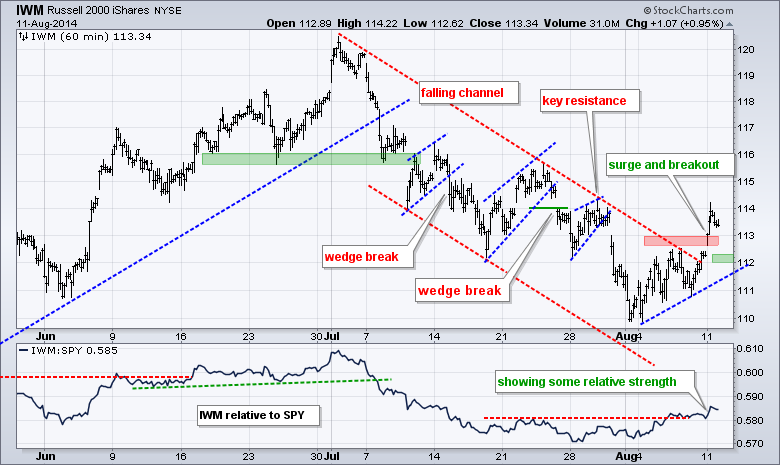
After showing signs of relative strength last week, IWM caught a bid on Monday and broke above resistance in the 113 area. The gap and breakout are bullish as long as they hold so traders can watch 112 for the first signs of failure. The indicator window shows the price relative breaking above its late July highs last week and moving higher on Monday as IWM outperforms SPY in August.
**************************************************************
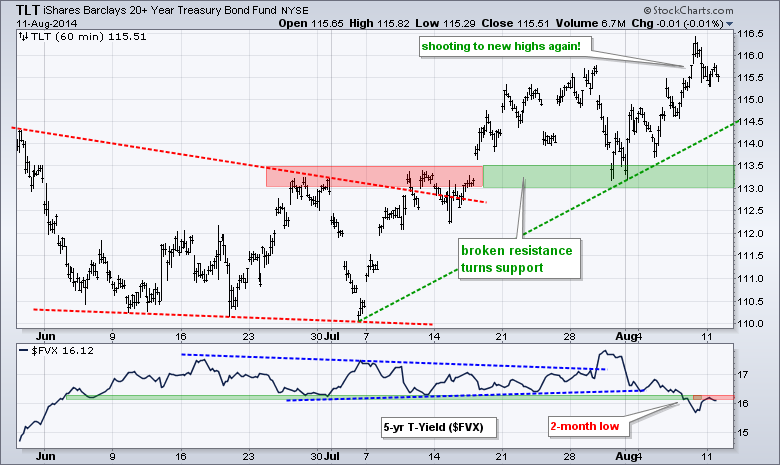
TLT fell back from last week's high as money moved into riskier assets over the last two days. The overall trend remains up with broken resistance turning into first support in the 113-113.5 area. The indicator window shows the 5-year Treasury Yield ($FVX) breaking below its July lows and this break turning into the first resistance level to watch.
**************************************************************
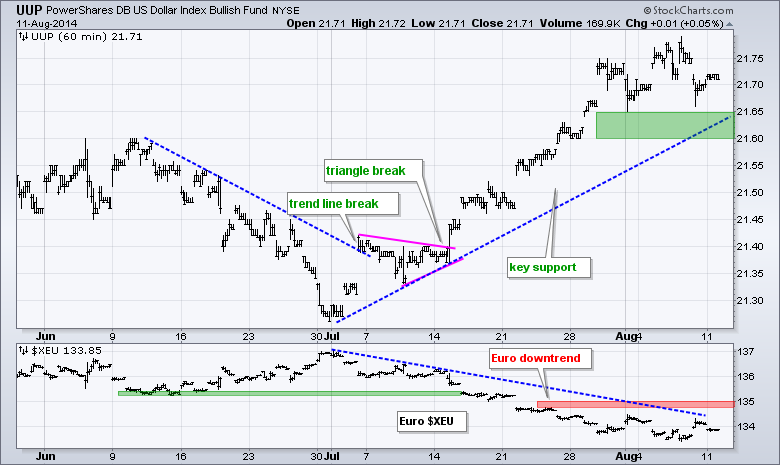
The advance in UUP stalled over the last two days, but the overall up trend remains in place. The Dollar is in an uptrend with support in the 21.6-21.65 area. The Euro is in a downtrend with resistance at 135. I am hesitant to raise support for the UUP, but will remain bullish on the Dollar as long as the Euro holds below key resistance. Dollar strength could be negative for oil and gold.
**************************************************************
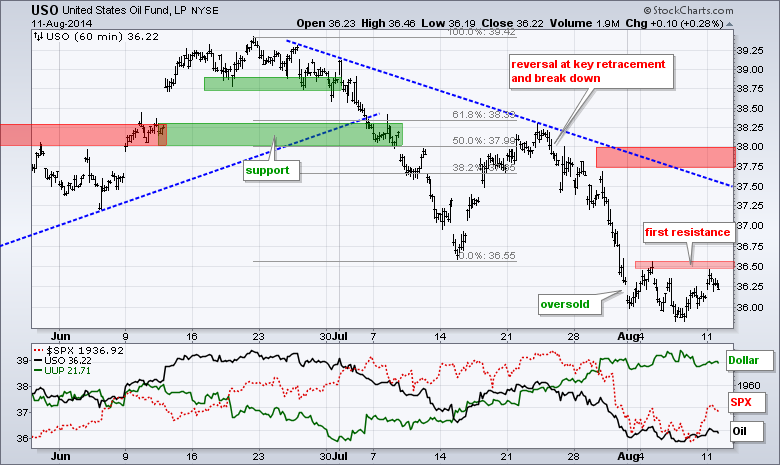
USO got a small bounce along with the stock market, but the ETF remains in a downtrend overall and any strength would be considered just an oversold bounce. USO is consolidating within the downtrend with this week's high marking the very first resistance level to watch. A breakout would signal the start of an oversold bounce, not a short-term uptrend. I will leave key resistance in the 37.75-38 area for now.
**************************************************************
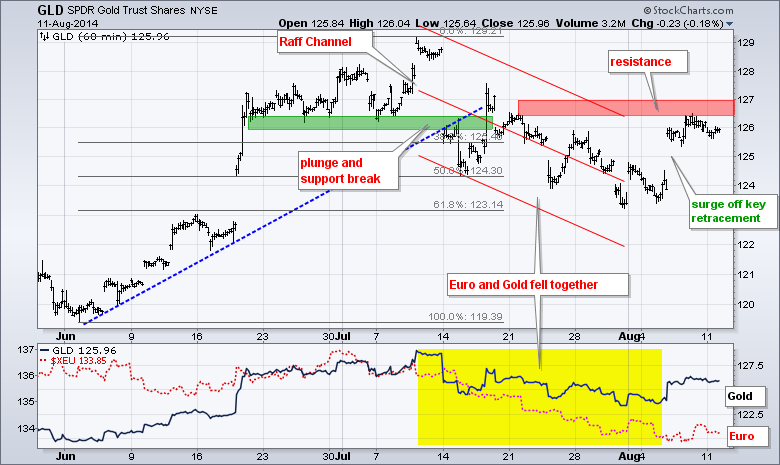
GLD surged above 125, stalled near the resistance zone and pulled back slightly on Monday. I am still waiting for a follow through breakout before considering a short-term trend reversal. While this decline may be corrective, it is still a downtrend as long as resistance holds. Furthermore, an uptrend in the Dollar is negative for gold and the Dollar weighs more on gold that geopolitical events. The situations in Iraq, Ukraine, Gaza and elsewhere are not new and are likely to drag on for a long time.
***************************************************************
Key Reports and Events (all times Eastern):
Tue - Aug 12 - 10:00 - JOLTS - Job Openings
Wed - Aug 13 - 07:00 - MBA Mortgage Index
Wed - Aug 13 - 08:30 - Retail Sales
Wed - Aug 13 - 10:30 - Crude Oil Inventories
Thu - Aug 14 - 08:30 - Initial Claims
Thu - Aug 14 - 10:30 - Natural Gas Inventories
Fri - Aug 15 - 08:30 - Producer Price Index (PPI)
Fri - Aug 15 - 08:30 - Empire State Manufacturing
Fri - Aug 15 - 09:15 - Industrial Production
Fri - Aug 15 - 09:55 - Michigan Sentiment
This commentary and charts-of-interest are designed to stimulate thinking. This analysis is not a recommendation to buy, sell, hold or sell short any security (stock ETF or otherwise). We all need to think for ourselves when it comes to trading our own accounts. First, it is the only way to really learn. Second, we are the only ones responsible for our decisions. Think of these charts as food for further analysis. Before making a trade, it is important to have a plan. Plan the trade and trade the plan. Among other things, this includes setting a trigger level, a target area and a stop-loss level. It is also important to plan for three possible price movements: advance, decline or sideways. Have a plan for all three scenarios BEFORE making the trade. Consider possible holding times. And finally, look at overall market conditions and sector/industry performance.
