I am going straight to the charts, but here is a summary. QQQ, IWM and SPY remain in downtrends. QQQ and SPY held the late July support breaks. IWM, however, is showing some relative strength over the past weeks and chartists should watch for a breakout. Treasuries continue to move higher and yields lower. Gold got a pop even though the Dollar remains strong and is on the verge of a breakout.
**This chart analysis is for educational purposes only, and should not
be construed as a recommendation to buy, sell or sell-short said securities**
**************************************************************
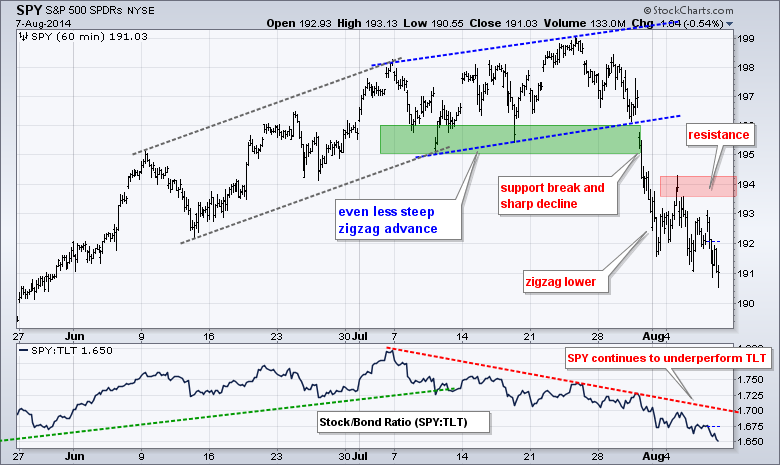
SPY broke support at the end of July with a sharp decline to 192 and then worked its way lower with a little zigzag to 191. Even though this could be just a correction within a bigger uptrend, sellers remain in control of the short-term trend as long as this zigzag remains. I am setting resistance in the 194 area and will require a break above this zone to reverse the short-term downtrend.
**************************************************************
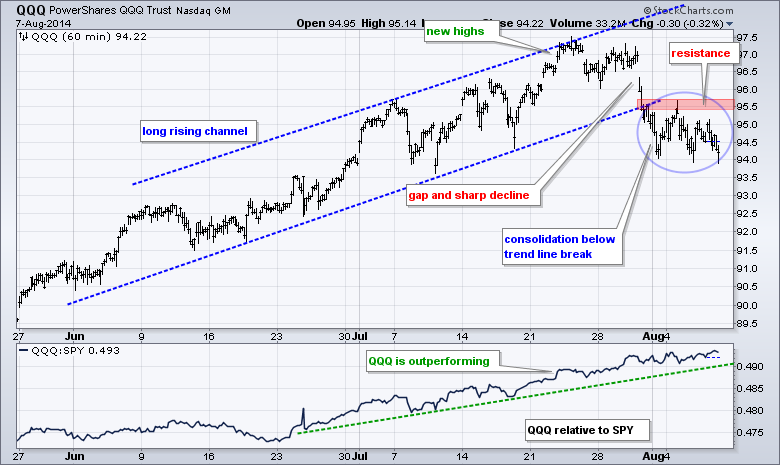
QQQ broke the channel trend line with a sharp decline in late July and the ETF should be considered in a down trend. A consolidation formed below this trend line break and I am marking resistance in the 95.5 area. The channel break remains in force as long as this resistance zone holds.
**************************************************************
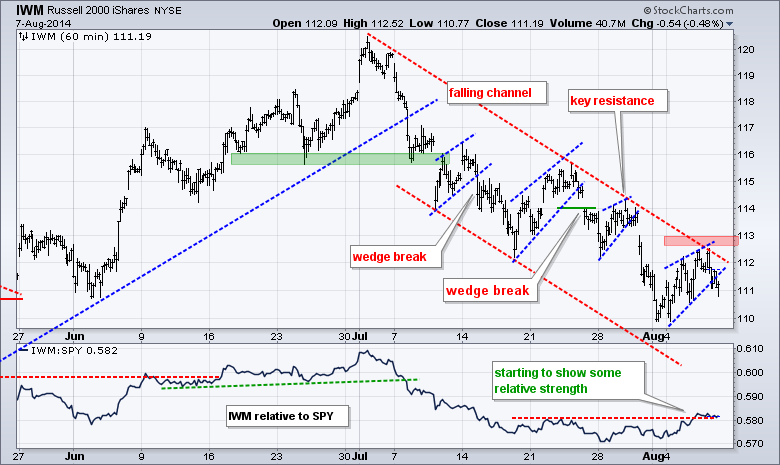
IWM remains within a falling channel and in a clear downtrend. The ETF formed another rising wedge with the early August bounce and moved below the lower trend line on Thursday. This break signals yet another continuation lower. One of these wedge breaks will fail, but the downtrend rules as long as the channel holds. I am lowering key resistance to the 113 level. A move above 113 would break the upper trend line of the rising channel and exceed the wedge high.
**************************************************************
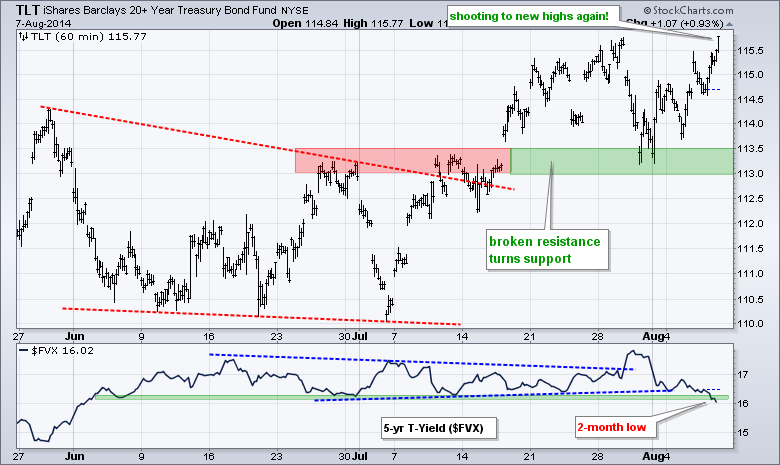
TLT surged again as money moved into US Treasury Bonds. This is negative for stocks because it suggests a certain flight to safety and takes money away from the stock market. TLT broke resistance in mid July and broken resistance turned into support in the 113-113.5 area. The indicator window shows the 5-year Treasury Yield ($FVX) moving to a two month low.
**************************************************************
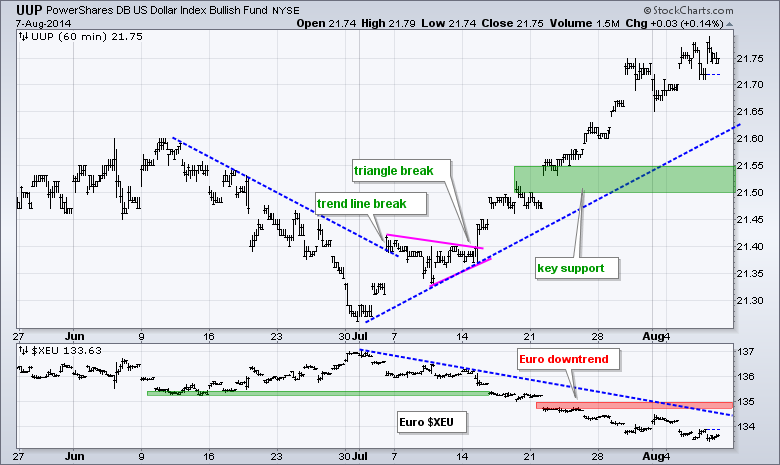
No change here. UUP remains in a strong uptrend and $XEU remains in a strong downtrend. The moves may be getting extended, but pullbacks would be viewed as corrections within the uptrend. Key support for UUP is set at 21.50 and key resistance for $XEU is set at 135.
**************************************************************
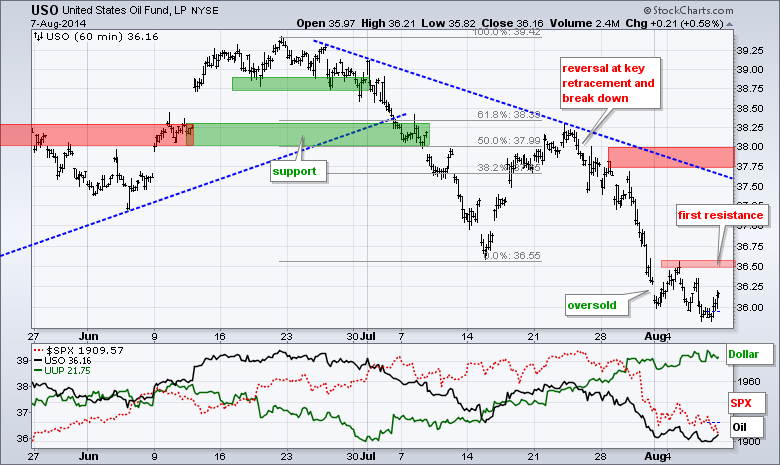
USO broke down last week and became short-term oversold near 36. The ETF got a small bounce, but fell back to 36 almost immediately. The trend here is down with this week's high marking the very first resistance level to watch. A breakout would signal the start of an oversold bounce, not a short-term uptrend. I will leave key resistance in the 37.75-38 area for now.
**************************************************************
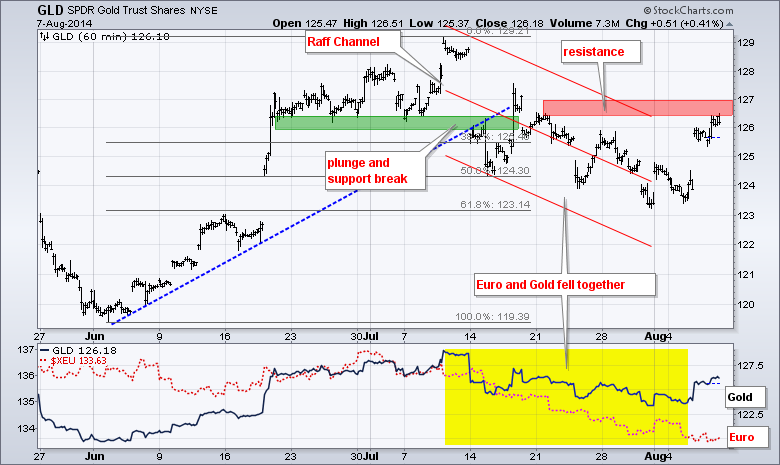
The Euro continued lower, but gold got a bounce over the last two days and GLD challenged resistance. Tensions remain high in Gaza, Ukraine and Iraq, and this probably put a bid into gold. Overall, GLD bounced off the 62% retracement and a follow through breakout at 127 would end the correction of the last 5-6 weeks. This would signal a continuation of the prior advance and target a move above 130.
***************************************************************
Key Reports and Events (all times Eastern):
Fri - Aug 08 - 08:00 - ChartCon
This commentary and charts-of-interest are designed to stimulate thinking. This analysis is not a recommendation to buy, sell, hold or sell short any security (stock ETF or otherwise). We all need to think for ourselves when it comes to trading our own accounts. First, it is the only way to really learn. Second, we are the only ones responsible for our decisions. Think of these charts as food for further analysis. Before making a trade, it is important to have a plan. Plan the trade and trade the plan. Among other things, this includes setting a trigger level, a target area and a stop-loss level. It is also important to plan for three possible price movements: advance, decline or sideways. Have a plan for all three scenarios BEFORE making the trade. Consider possible holding times. And finally, look at overall market conditions and sector/industry performance.


