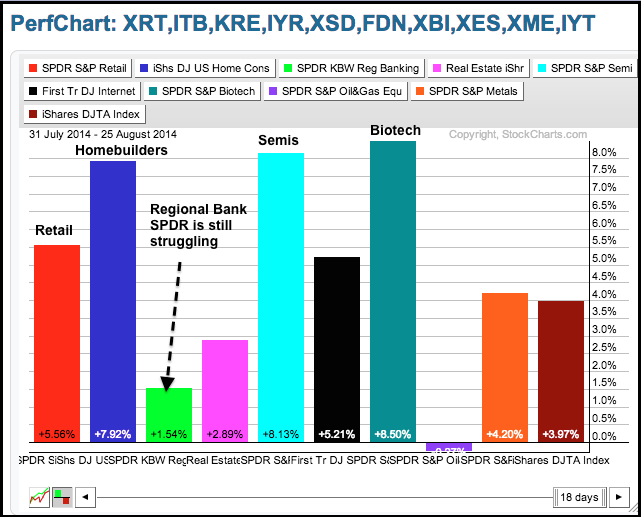
Stocks opened strong and then traded flat the rest of the day. The major index ETFs closed with small gains as the opening surge held. All nine sectors were higher with the Finance SPDR (XLF) and Energy SPDR (XLE) leading the way. Energy is getting an oversold bounce and money appears to be rotating into the banks. The Broker-Dealer iShares (IAI) surged over 1%, but the Regional Bank SPDR (KRE) lagged with a .13% gain. Charts of interest are shown in the second half of this post.
**This chart analysis is for educational purposes only, and should not
be construed as a recommendation to buy, sell or sell-short said securities**
**************************************************************
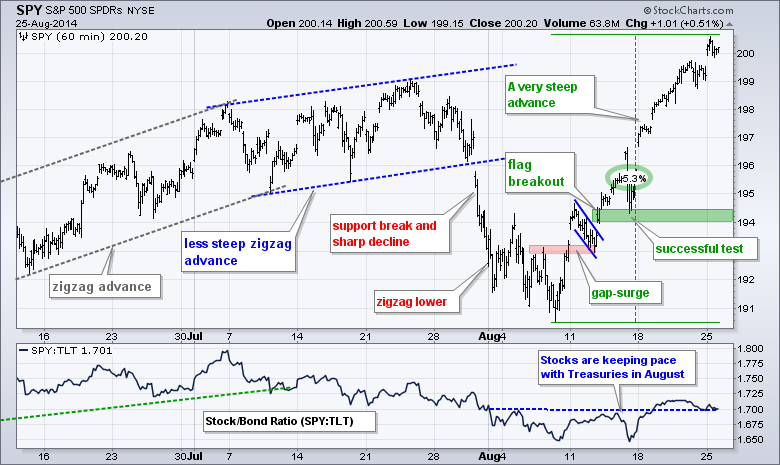
No change. SPY is around 5% from its early August low to last week's high. Even though this advance is steep and the ETF seems short-term overbought, the move reflects strong buying pressure and the bulls still have the edge. The flag breakout near 194 is the last signal and the ETF tested this breakout with a small pullback in mid August. I will leave key support at 194 for now.
**************************************************************
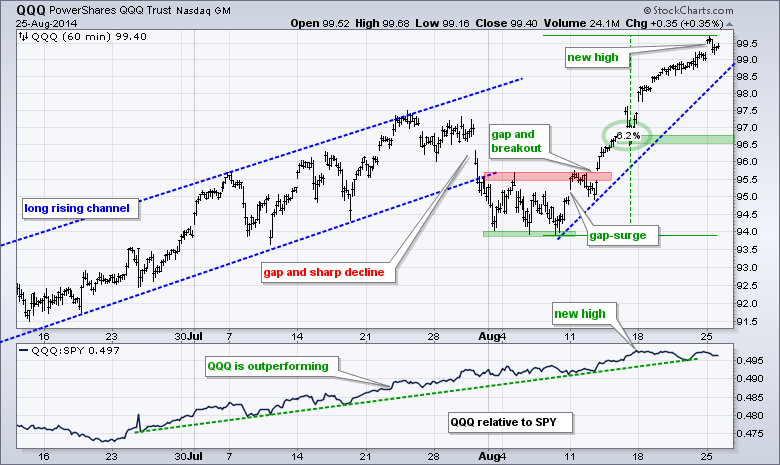
No change. QQQ continues to lead overall with a 5.8% surge the last two weeks. The ETF hit a new high last week and the price relative (QQQ:SPY ratio) remains in an uptrend. Marking support at this stage is a challenge because the advance is so sharp. I will, therefore, leave key support at 96.5 for now.
**************************************************************
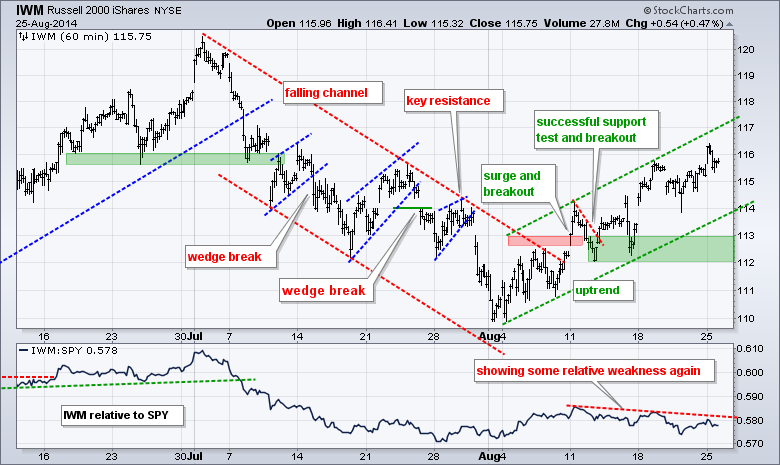
No change. IWM does show relative weakness, but the trend is up as the ETF works its way higher this month. The lower trend line and the mid August lows mark support in the 112-113 area. While I am concerned this could be a rising flag, which is bearish, the short-term trend is up as long as the flag rises.
**************************************************************
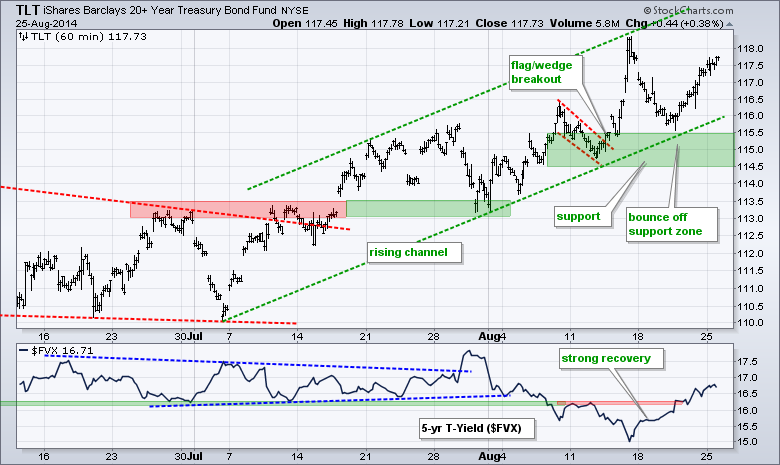
No change. The 20+ YR T-Bond ETF (TLT) bounced with a move above 117, but the 5-year Treasury Yield ($FVX) moved higher with a move above 16.5 (1.65%). This means long-term yields moved lower and short-term yields moved higher. The bond market is clearly split with the 10-YR Treasury Yield ($TNX) in a downtrend and the 2-year Treasury Yield ($UST2Y) in an uptrend. TLT bounced to affirm support in the 114.5-115.5 area.
**************************************************************
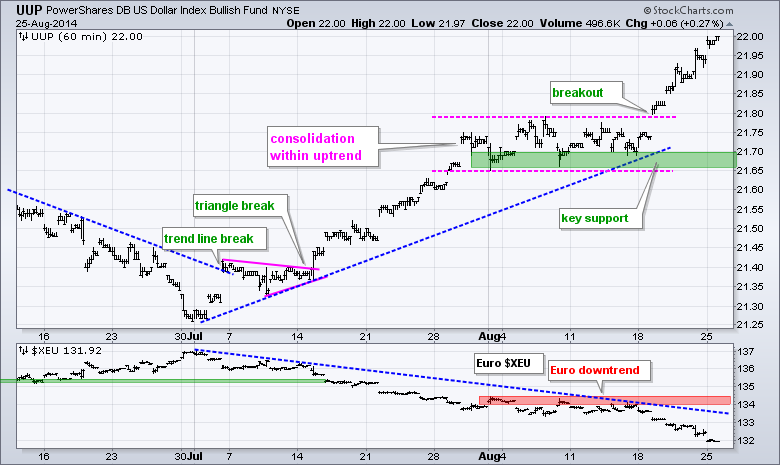
No change. The US Dollar ETF (UUP) broke out with a big move last week to extend the uptrend, which began with the mid July breakout. The August lows mark key support. Dollar strength may be hinting at higher rates and a strong US economy. The Euro Index ($XEU) broke down further and hit new lows for the summer. I will mark key resistance at 134.50.
**************************************************************
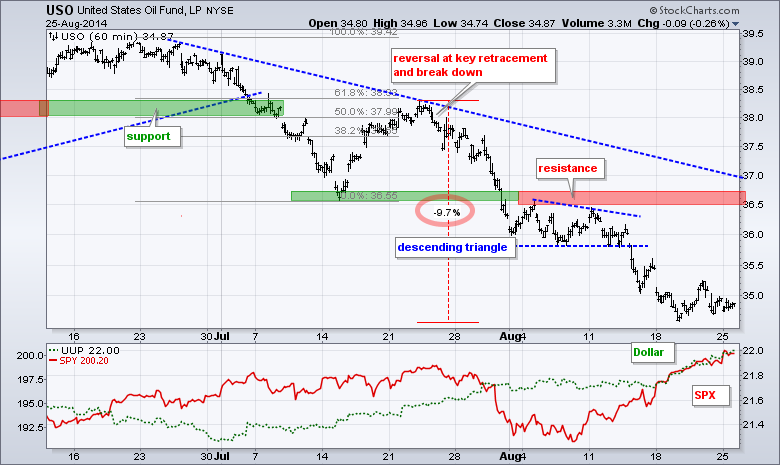
No change. The USO Oil Fund (USO) broke down in mid August, fell below 35 last week and consolidated the last few days. It is a weird combo, but oil is about as oversold as stocks are overbought. USO is down almost 10% over the last five weeks. The early August highs mark key resistance in the 36.5 area.
**************************************************************
No change. The Gold SPDR (GLD) remains in a falling channel and short-term downtrend. Note that this downtrend started with the early July plunge below 126. GLD has formed lower highs and lower lows since. The lower trend line of the falling channel marks the next potential target. I will leave key resistance at 127 for now.

***************************************************************
Key Reports and Events (all times Eastern):
Tue - Aug 26 - 08:30 - Durable Goods Orders
Tue - Aug 26 - 09:00 - Case-Shiller Housing Index
Tue - Aug 26 - 09:00 - FHFA Housing Price Index
Tue - Aug 26 - 10:00 - Consumer Confidence
Wed - Aug 27 - 07:00 - MBA Mortgage Index
Wed - Aug 27 - 10:30 - Crude Oil Inventories
Thu - Aug 28 - 08:30 - Initial Jobless Claims
Thu - Aug 28 - 08:30 - GDP
Thu - Aug 28 - 10:00 - Pending Home Sales
Thu - Aug 28 - 10:30 - Natural Gas Inventories
Fri - Aug 29 - 08:30 - Personal Income & Spending
Fri - Aug 29 - 08:30 - PCE Prices
Fri - Aug 29 - 09:45 - Chicago PMI
Fri - Aug 29 - 09:55 - Michigan Sentiment
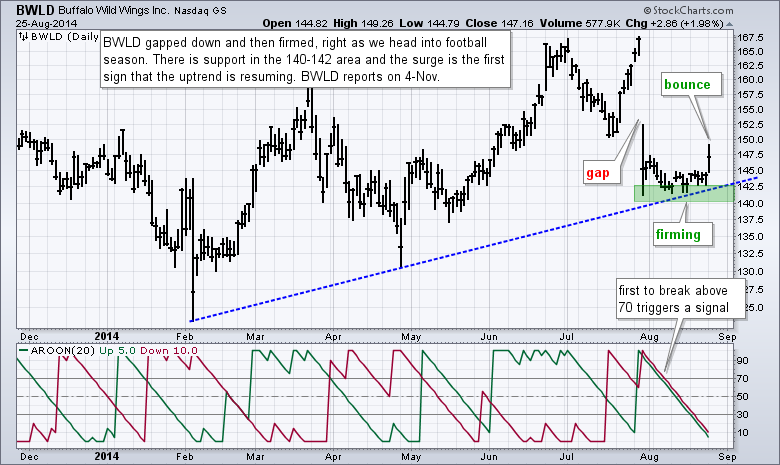
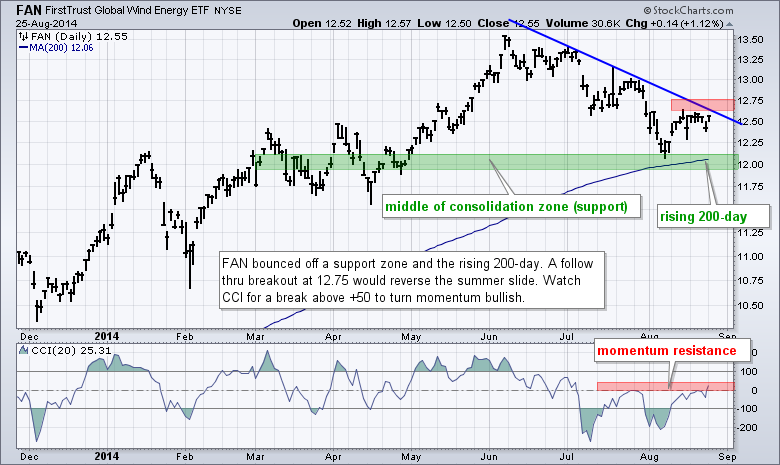
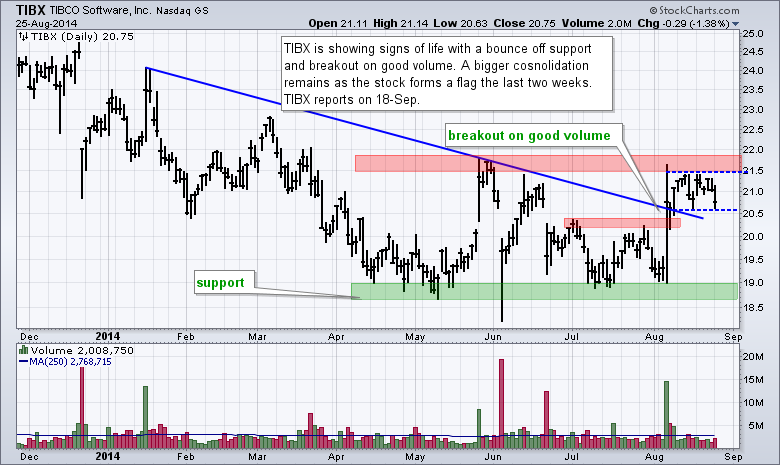
Chart Setups:
This commentary and charts-of-interest are designed to stimulate thinking. This analysis is not a recommendation to buy, sell, hold or sell short any security (stock ETF or otherwise). We all need to think for ourselves when it comes to trading our own accounts. First, it is the only way to really learn. Second, we are the only ones responsible for our decisions. Think of these charts as food for further analysis. Before making a trade, it is important to have a plan. Plan the trade and trade the plan. Among other things, this includes setting a trigger level, a target area and a stop-loss level. It is also important to plan for three possible price movements: advance, decline or sideways. Have a plan for all three scenarios BEFORE making the trade. Consider possible holding times. And finally, look at overall market conditions and sector/industry performance.


