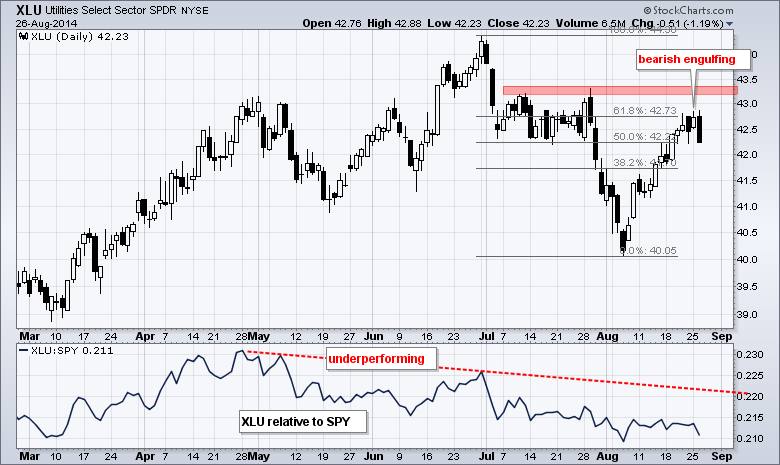
Stocks edged higher again with the Russell 2000 iShares (IWM) leading the way, though the gain was just .65%. Eight of the nine sectors were higher with the Energy SPDR (XLE) and Finance SPDR (XLF) leading. The Utilities SPDR (XLU) was the lone loser. As the chart below shows, XLU bounced with the rest of the market this month and retraced 62% of the prior decline. The ETF then formed a bearish engulfing on Tuesday. There is also resistance from the July consolidation in the 43 area and the ETF is showing relative weakness since early May.
**This chart analysis is for educational purposes only, and should not
be construed as a recommendation to buy, sell or sell-short said securities**
**************************************************************
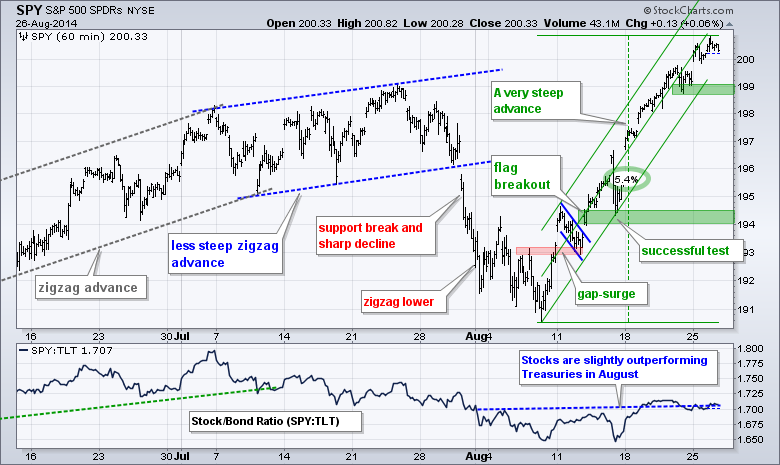
SPY is up around 5% since August 7th. This is a very steep advance and the ETF seems short-term overbought, but selling pressure remains subdued. I am going to leave key support at 194 because I see now other place to put it for now. A Raff Regression Channel extending up from the 7-Aug low and a small buffer can be used to mark a tighter support level at 198.50.
**************************************************************
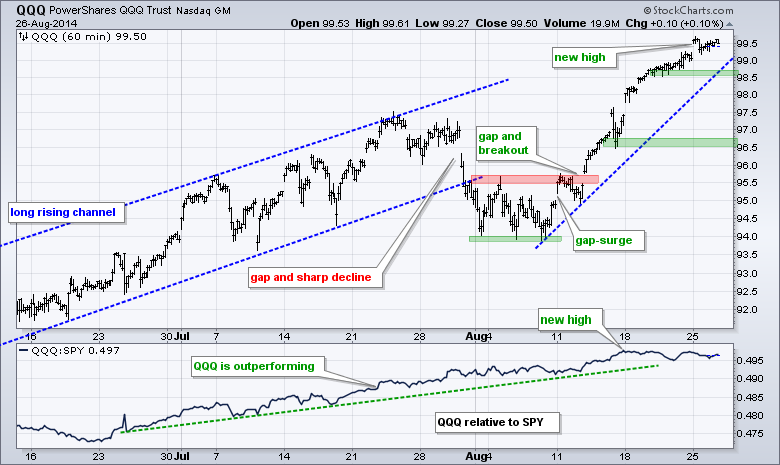
QQQ surged around 6% the last three weeks and looks short-term overbought. The early August trend line and 20-Aug lows mark first support at 98.50. I would not, however, call this key support just yet. For now, I am leaving key support at 96.5, but I expect to raise this level in the coming days.
**************************************************************
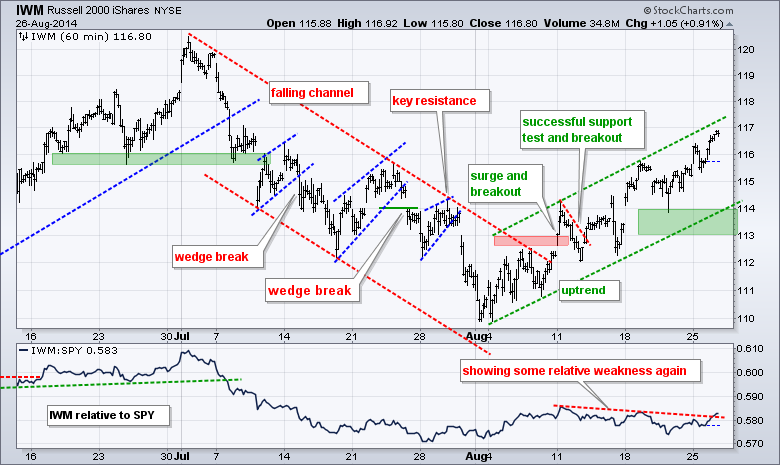
IWM showed a little relative strength on Tuesday with a surge towards 117. Notice how the price relative (IWM:SPY ratio) turned up and broke the two week trend line. Overall, IWM remains in a clear uptrend that is defined by a rising channel. The lower trend line and a buffer mark key support in the 113-114 area. IWM may be lagging, but it is trending up and trend trumps all.
**************************************************************
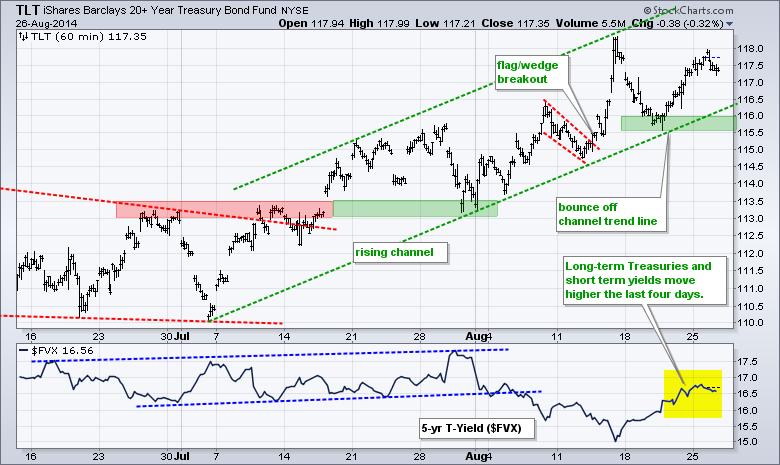
The 20+ YR T-Bond ETF (TLT) remains within a rising price channel. The ETF bounced off the lower trend line last week and I am raising key support to the 115.5-116 area. A move below this level would break the trend line and last week's low. Something strange is happening because TLT and the 5-year Treasury Yield ($FVX) both moved higher the last four days. Something needs to give.
**************************************************************
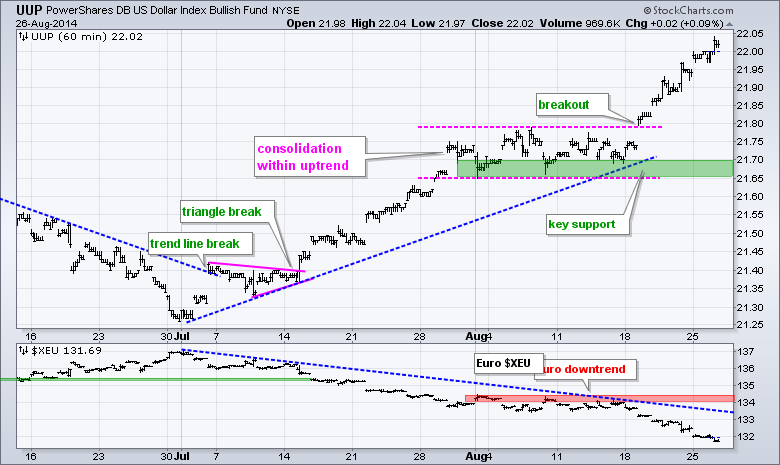
No change. The US Dollar ETF (UUP) broke out with a big move last week to extend the uptrend, which began with the mid July breakout. The August lows mark key support. Dollar strength may be hinting at higher rates and a strong US economy. The Euro Index ($XEU) broke down further and hit new lows for the summer. I will mark key resistance at 134.50.
**************************************************************
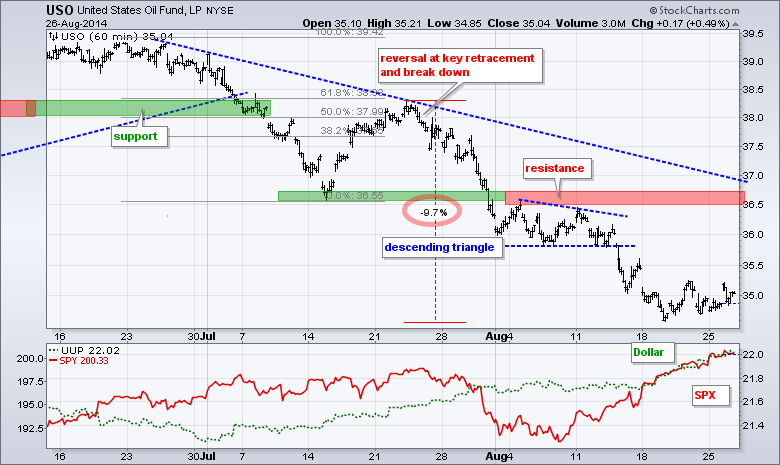
No change. The USO Oil Fund (USO) broke down in mid August, fell below 35 last week and consolidated the last few days. It is a weird combo, but oil is about as oversold as stocks are overbought. USO is down almost 10% over the last five weeks. The early August highs mark key resistance in the 36.5 area.
**************************************************************
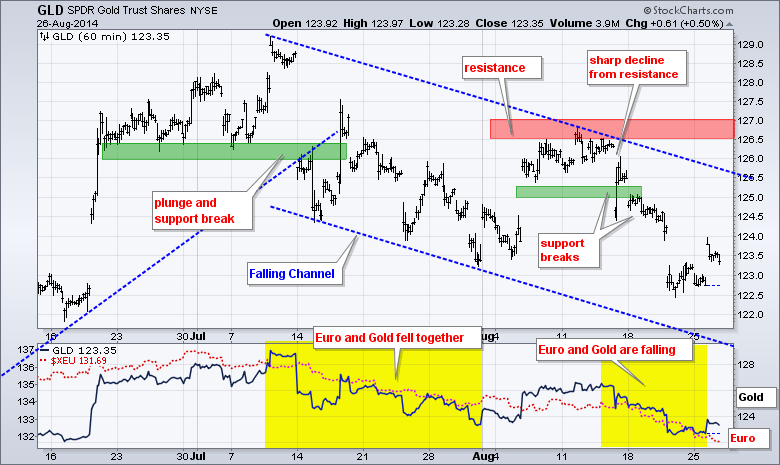
No change. The Gold SPDR (GLD) remains in a falling channel and short-term downtrend. Note that this downtrend started with the early July plunge below 126. GLD has formed lower highs and lower lows since. The lower trend line of the falling channel marks the next potential target. I will leave key resistance at 127 for now.
***************************************************************
Key Reports and Events (all times Eastern):
Wed - Aug 27 - 07:00 - MBA Mortgage Index
Wed - Aug 27 - 10:30 - Crude Oil Inventories
Thu - Aug 28 - 08:30 - Initial Jobless Claims
Thu - Aug 28 - 08:30 - GDP
Thu - Aug 28 - 10:00 - Pending Home Sales
Thu - Aug 28 - 10:30 - Natural Gas Inventories
Fri - Aug 29 - 08:30 - Personal Income & Spending
Fri - Aug 29 - 08:30 - PCE Prices
Fri - Aug 29 - 09:45 - Chicago PMI
Fri - Aug 29 - 09:55 - Michigan Sentiment
This commentary and charts-of-interest are designed to stimulate thinking. This analysis is not a recommendation to buy, sell, hold or sell short any security (stock ETF or otherwise). We all need to think for ourselves when it comes to trading our own accounts. First, it is the only way to really learn. Second, we are the only ones responsible for our decisions. Think of these charts as food for further analysis. Before making a trade, it is important to have a plan. Plan the trade and trade the plan. Among other things, this includes setting a trigger level, a target area and a stop-loss level. It is also important to plan for three possible price movements: advance, decline or sideways. Have a plan for all three scenarios BEFORE making the trade. Consider possible holding times. And finally, look at overall market conditions and sector/industry performance.


