Stocks opened strong and closed strong with small-caps leading the way. Eight of the nine sectors were higher with industrials and finance leading. The utilities sector lost ground. The Home Construction iShares (ITB) and the Retail SPDR (XRT) lifted the consumer discretionary sector. Strength in these two groups would be most welcome. Even the Regional Bank SPDR (KRE) got a pop and the Broker-Dealer iShares (IAI) advanced over 1%. Note that all stocks in the Broker-Dealer iShares and the Transport iShares (IYT) gained on Monday. Transports were higher because oil hit a six month low. Note that Brent Crude ($BRENT) moved to its lowest level of year.
**This chart analysis is for educational purposes only, and should not
be construed as a recommendation to buy, sell or sell-short said securities**
**************************************************************
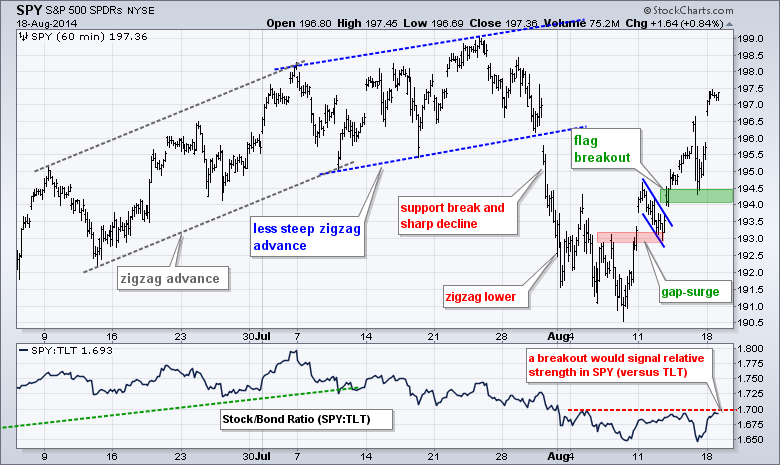
SPY opened strong and finished strong to extend its short-term uptrend. With this move, I will raise key support to the 194-194.5 area. Note that the SPY:TLT ratio is near the prior August peaks. A break above these peaks would signal relative strength in stocks (versus Treasuries).
**************************************************************
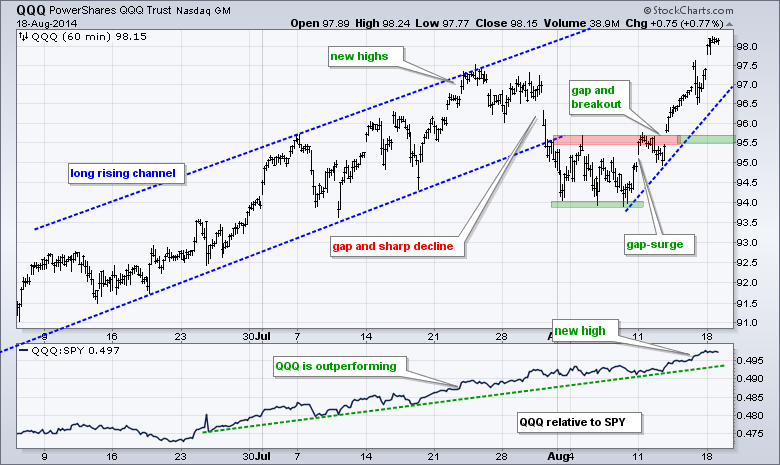
QQQ continues to lead overall with a surge above the July highs. The ETF fell back rather sharply in late July, stabilized and then broke out with a pair of gaps. Broken resistance marks support in the 95.5 area. The indicator window shows the price relative (QQQ:SPY ratio) moving to a new high.
**************************************************************
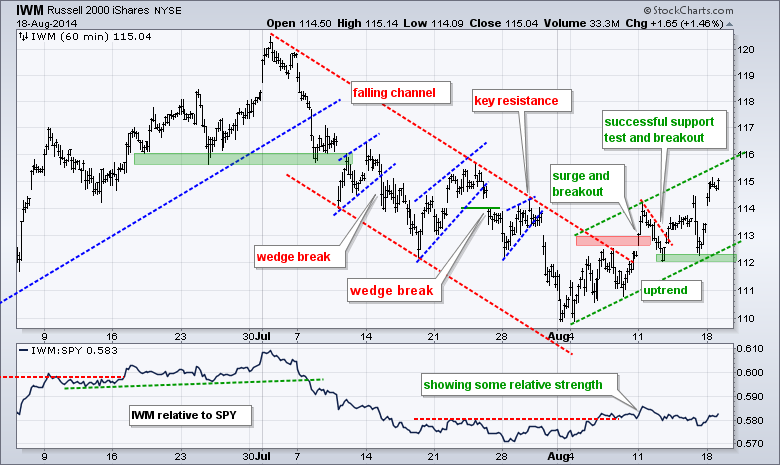
IWM extended its short-term uptrend with a gap and strong close. This move reinforces support in the 112 area. There is always a chance that the August rally could end up as a rising flag on the daily chart, but this would not be bearish until a break below short-term support at 112.
**************************************************************
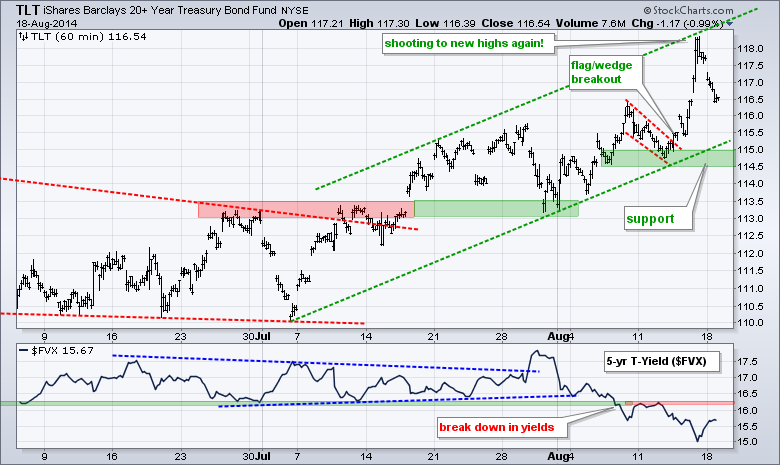
TLT surged to new highs last week and hit the upper trend line of the rising channel. The ETF was quite overbought after this surge and fell back sharply on Monday. The lower trend line of the rising channel and last week's lows mark key support in the 114.5-115 area.
**************************************************************
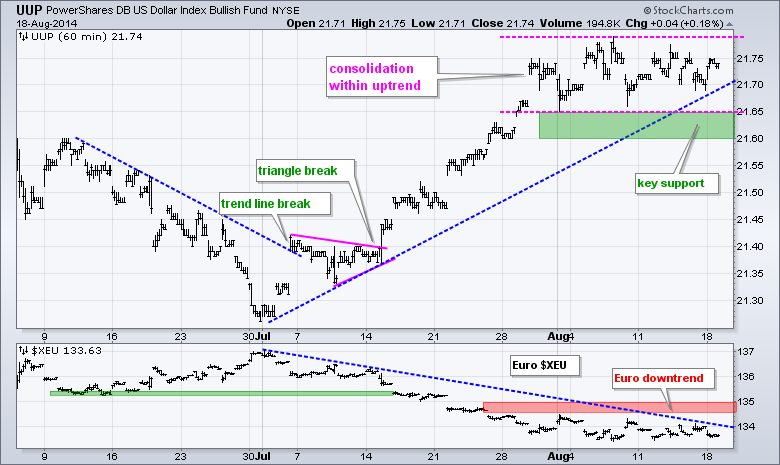
No change. The advance in UUP stalled over the last few days, but the overall up trend remains in place. The Dollar is in an uptrend with support in the 21.6-21.65 area. The Euro is in a downtrend with resistance at 135. I am hesitant to raise support for the UUP, but will remain bullish on the Dollar as long as the Euro holds below key resistance. Dollar strength could be negative for oil and gold.
**************************************************************
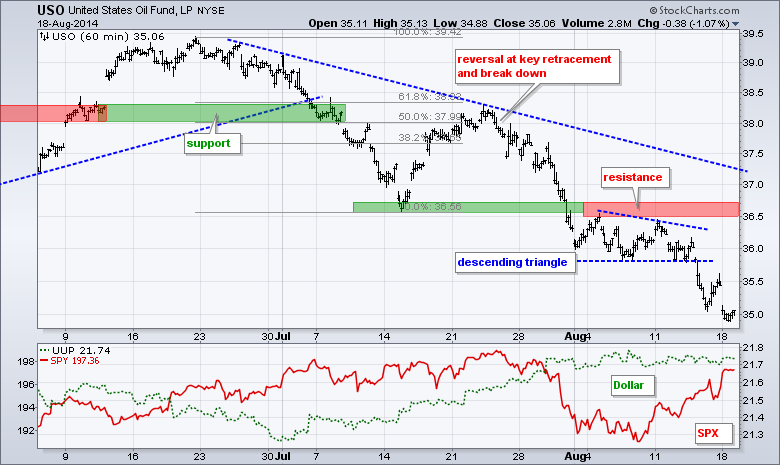
No change. USO broke down in late July, consolidated in early August and continued lower with a sharp decline below 35.50 last week. Ouch. There is simply no bid here. Broken support and the August highs mark key resistance in the 36.5-35.75 area.
**************************************************************
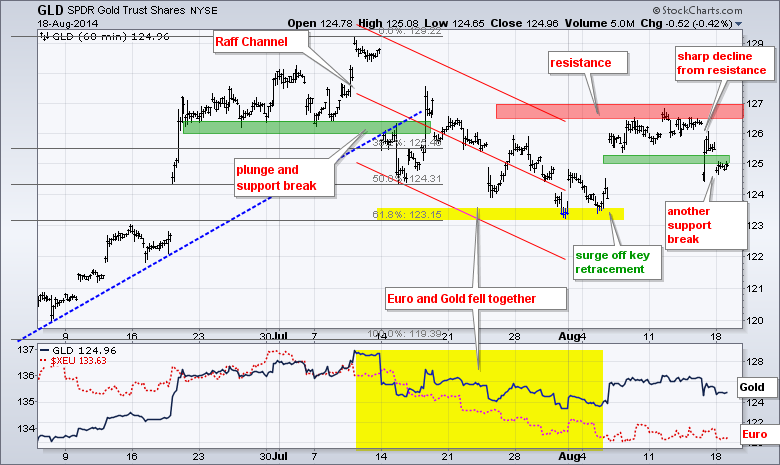
Gold broke below support at 125 for the second time in two days. This decline reinforces resistance in the 126.5-127 area. In addition, this decline keeps the downtrend alive, which has been in force since the mid July break down. A break above 127 is needed to reverse this short-term downtrend. Continued weakness in the Euro is likely to weigh, as could an easing of international tensions.
***************************************************************
Key Reports and Events (all times Eastern):
Tue - Aug 19 - 08:30 - Consumer Price Index (CPI)
Tue - Aug 19 - 08:30 - Housing Starts/Building Permits
Wed - Aug 20 - 07:00 - MBA Mortgage Index
Wed - Aug 20 - 10:30 - Crude Oil Inventories
Wed - Aug 20 - 14:00 - FOMC Minutes
Thu - Aug 21 - 08:30 - Initial Jobless Claims
Thu - Aug 21 - 10:00 - Existing Home Sales
Thu - Aug 21 - 10:00 - Philadelphia Fed
Thu - Aug 21 - 10:00 - Leading Economic Indicators
Thu - Aug 21 - 10:30 - Natural Gas Inventories
Fri - Aug 22 - 10:00 - Happy Friday!
This commentary and charts-of-interest are designed to stimulate thinking. This analysis is not a recommendation to buy, sell, hold or sell short any security (stock ETF or otherwise). We all need to think for ourselves when it comes to trading our own accounts. First, it is the only way to really learn. Second, we are the only ones responsible for our decisions. Think of these charts as food for further analysis. Before making a trade, it is important to have a plan. Plan the trade and trade the plan. Among other things, this includes setting a trigger level, a target area and a stop-loss level. It is also important to plan for three possible price movements: advance, decline or sideways. Have a plan for all three scenarios BEFORE making the trade. Consider possible holding times. And finally, look at overall market conditions and sector/industry performance.


