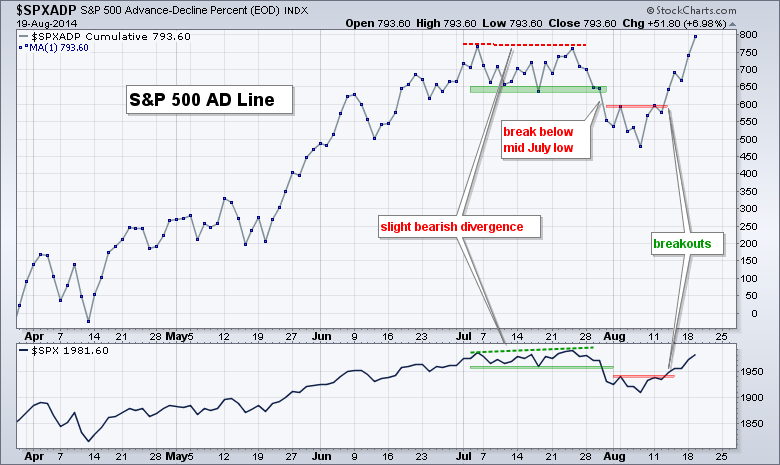
Stocks opened strong and remained strong on Tuesday. SPY and IWM are up almost four percent over the last eight days. QQQ is up 4.75% and leading the pack. The advance is getting a little extended for the short-term, but overbought is a sign of strength, not weakness. Of note, the Home Construction iShares (ITB) and the Retail SPDR (XRT) led the industry-group ETFs with big gains. It is quite positive to see these two "cyclical" groups leading, especially after a period of lagging. The chart below shows the S&P 500 AD Line ($SPXADP) moving to a new high and affirming the long-term uptrend. Even though the S&P 500 has yet to hit a new high, the strength in the AD Line suggests that the magnet at 2000 will pull the index higher.
**This chart analysis is for educational purposes only, and should not
be construed as a recommendation to buy, sell or sell-short said securities**
**************************************************************
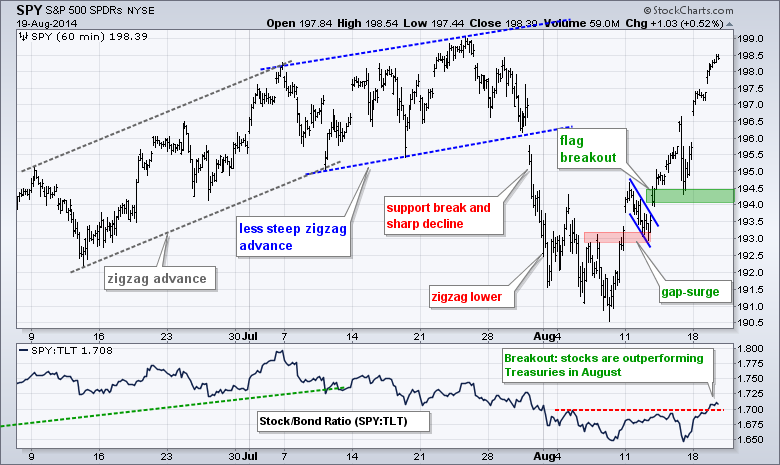
SPY opened strong and finished strong for the second day running. This strong move extends the short-term uptrend and I will leave key support at the 194-194.5 area for now. The SPY:TLT ratio broke above its early and mid August highs this week, which means stocks are outperforming Treasuries this month.
**************************************************************
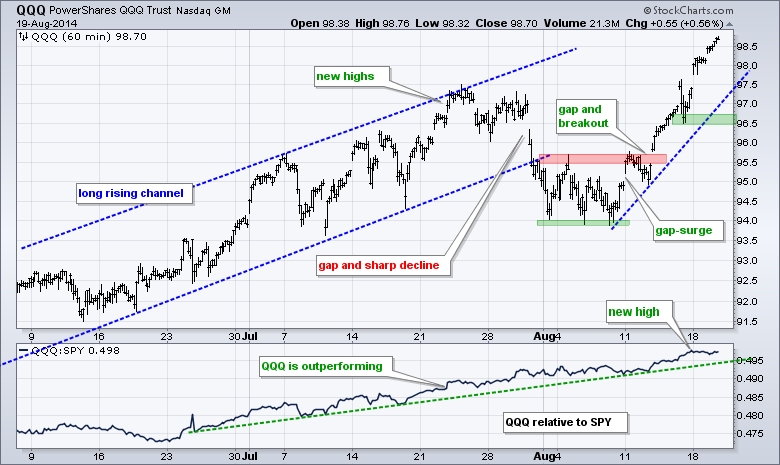
QQQ continues to lead overall with a surge above the July highs. The ETF has now gapped up twice in the last two weeks and held each gap. Friday's low marks first support in the 96.5 area. The indicator window shows the price relative (QQQ:SPY ratio) moving to a new high.
**************************************************************
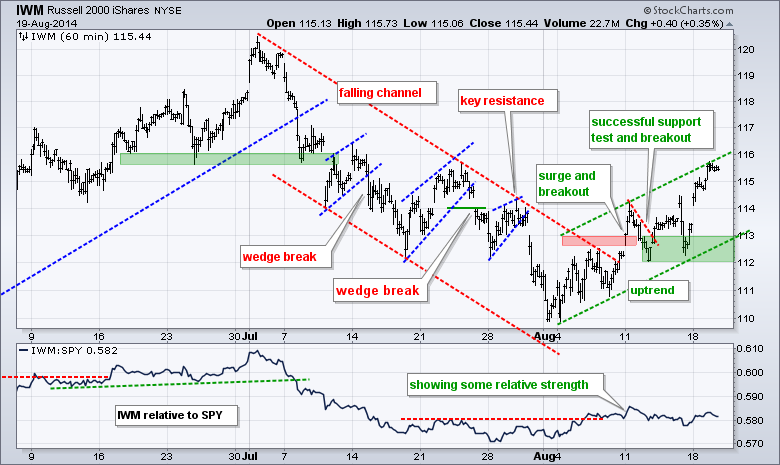
IWM extended its short-term uptrend with a move to the upper trend line of a potential rising channel, which looks like a flag on the daily chart. Even though a rising flag is typically a bearish pattern, the short-term trend is up as long as the flag rises and key support at 112-113 holds.
**************************************************************
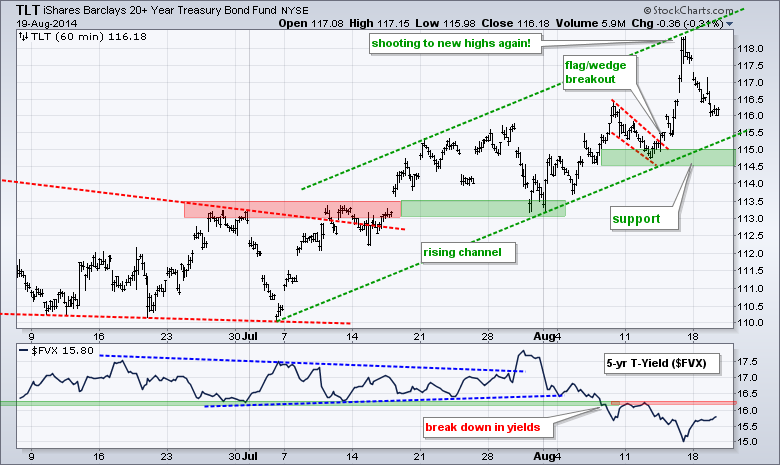
TLT hit the upper trend line of the rising channel and fell back over the last two days. This is still a decline within a bigger uptrend, but a little selling pressure in Treasuries is welcome news for stocks, and regional banks, which benefit from rising long-term yields. The lower trend line of the rising channel and last week's lows mark key support in the 114.5-115 area.
**************************************************************
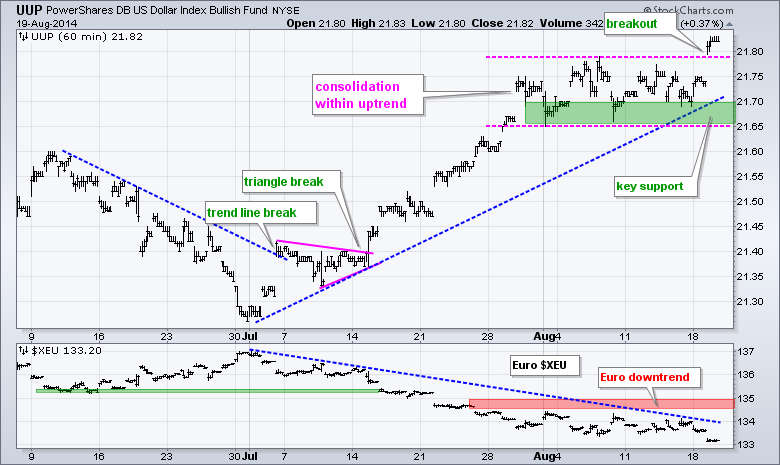
The Euro sank to new lows for the move and the US Dollar ETF (UUP) broke consolidation resistance. This move reinforces support in the 21.65-21.70 area for UUP. I will leave resistance at 135 for the Euro Index ($XEU). It is hard to say if the Dollar is strong or the Euro is weak. The Dollar benefits from a strengthening economy and the potential rise in Treasury yields. The Euro has been hampered by a very sluggish economy, Russian tensions and a dramatic decline in the Bund yield.
**************************************************************
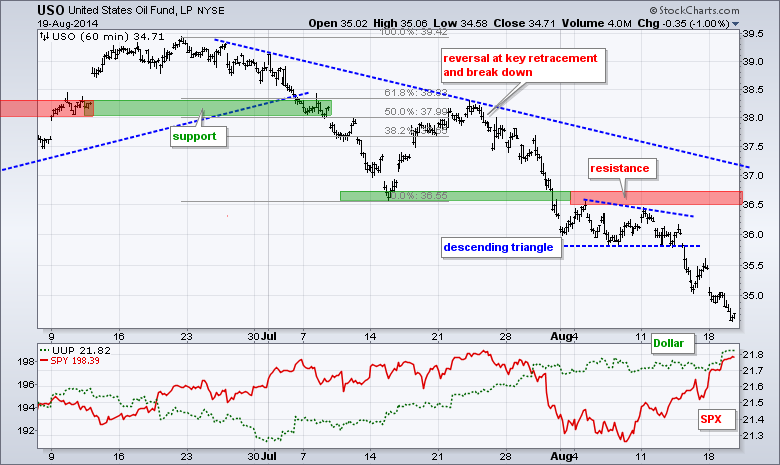
No change. USO broke down in late July, consolidated in early August and continued lower with a sharp decline below 35.50 last week. Ouch. There is simply no bid here. Broken support and the August highs mark key resistance in the 36.5-35.75 area.
**************************************************************
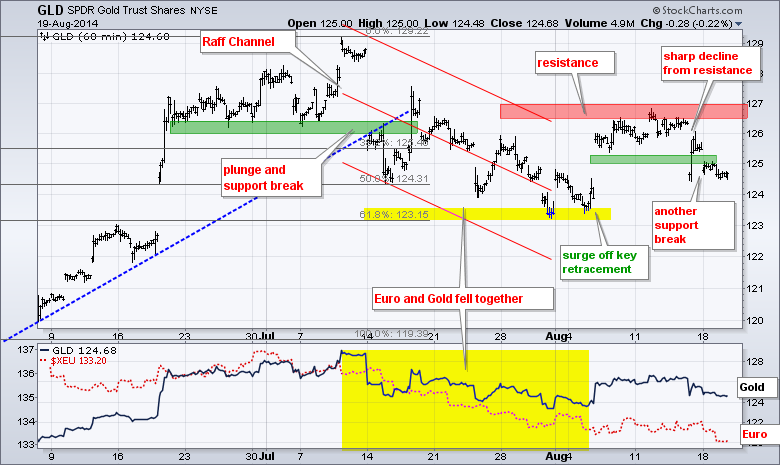
No change. Gold broke below support at 125 for the second time in two days. This decline reinforces resistance in the 126.5-127 area. In addition, this decline keeps the downtrend alive, which has been in force since the mid July break down. A break above 127 is needed to reverse this short-term downtrend. Continued weakness in the Euro is likely to weigh, as could an easing of international tensions.
***************************************************************
Key Reports and Events (all times Eastern):
Wed - Aug 20 - 07:00 - MBA Mortgage Index
Wed - Aug 20 - 10:30 - Crude Oil Inventories
Wed - Aug 20 - 14:00 - FOMC Minutes
Thu - Aug 21 - 08:30 - Initial Jobless Claims
Thu - Aug 21 - 10:00 - Existing Home Sales
Thu - Aug 21 - 10:00 - Philadelphia Fed
Thu - Aug 21 - 10:00 - Leading Economic Indicators
Thu - Aug 21 - 10:30 - Natural Gas Inventories
Fri - Aug 22 - 10:00 - Happy Friday!
This commentary and charts-of-interest are designed to stimulate thinking. This analysis is not a recommendation to buy, sell, hold or sell short any security (stock ETF or otherwise). We all need to think for ourselves when it comes to trading our own accounts. First, it is the only way to really learn. Second, we are the only ones responsible for our decisions. Think of these charts as food for further analysis. Before making a trade, it is important to have a plan. Plan the trade and trade the plan. Among other things, this includes setting a trigger level, a target area and a stop-loss level. It is also important to plan for three possible price movements: advance, decline or sideways. Have a plan for all three scenarios BEFORE making the trade. Consider possible holding times. And finally, look at overall market conditions and sector/industry performance.


