If one follows the financial media, it seems as if Ukraine and Iraq are driving the markets these days. While these two regions are certainly a concern, I am not sure how much lasting influence they will have on the overall direction for US stocks. The German DAX Index ($DAX) is up over 1% on Monday and the Shanghai Composite ($SSEC) closed .57% higher. This is putting a positive bias on US stock futures. A strong open will keep the short-term uptrends alive, but I will be watching post-open price action for real clues on underlying strength. Treasuries remain in strong uptrends, but are getting overbought. The Dollar is consolidating within an uptrend. Oil remains under pressure and in a clear downtrend. Gold is looking vulnerable after a decline from resistance on Friday.
**This chart analysis is for educational purposes only, and should not
be construed as a recommendation to buy, sell or sell-short said securities**
**************************************************************
SPY opened strong on Friday, plunged on concerns in Ukraine and bounced in the final hour. While a potential resistance zone looms in the 196 area, the short-term trend is up and the flag breakout is holding. I am not going to raise key support to the 194 area just yet and will keep it in the 193 area.

**************************************************************
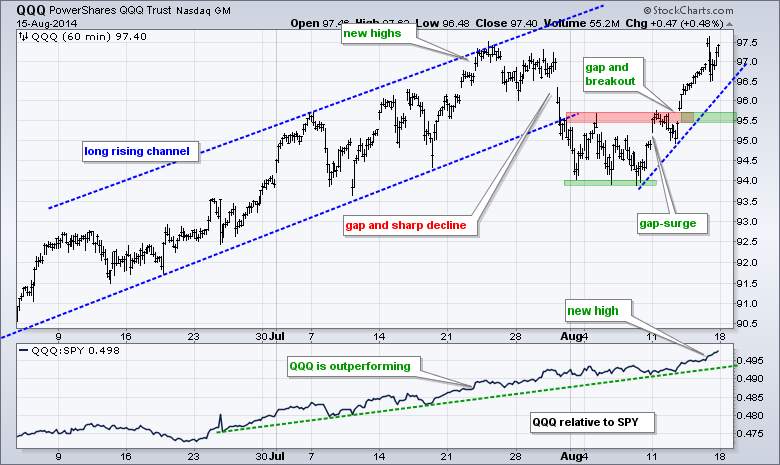
QQQ continues to lead overall with a surge to the July highs. The ETF fell back rather sharply in late July, stabilized and then broke out with a pair of gaps. Broken resistance marks support in the 95.5 area. The indicator window shows the price relative (QQQ:SPY ratio) moving to a new high.
**************************************************************
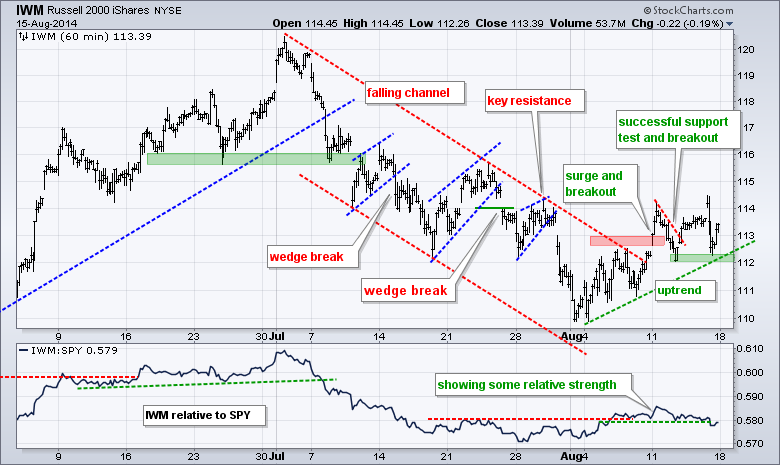
IWM broke out at 113 and led the market last Monday, but stalled out over the last few days and underperformed Tuesday thru Friday. The breakout and short-term uptrend are, however, still in place. Last week's lows and the early August trend line mark key support in the 112 area.
**************************************************************
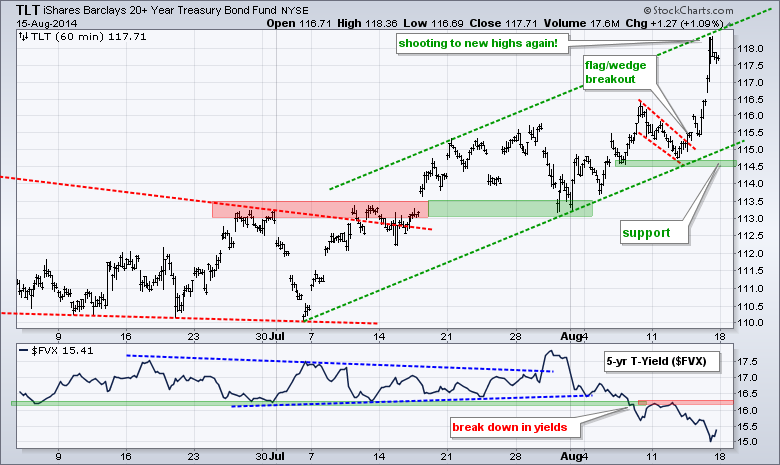
TLT surged to new highs as the market reacted to a tame Producer Price Index (PPI) and tensions in Ukraine. The move does seem a little overdone because TLT is up 2.6% in a few days and up 7% since early July. Also note that TLT is near the upper trend line of a rising channel. Last week's low and the lower trend line mark key support in the 114.5 area.
**************************************************************
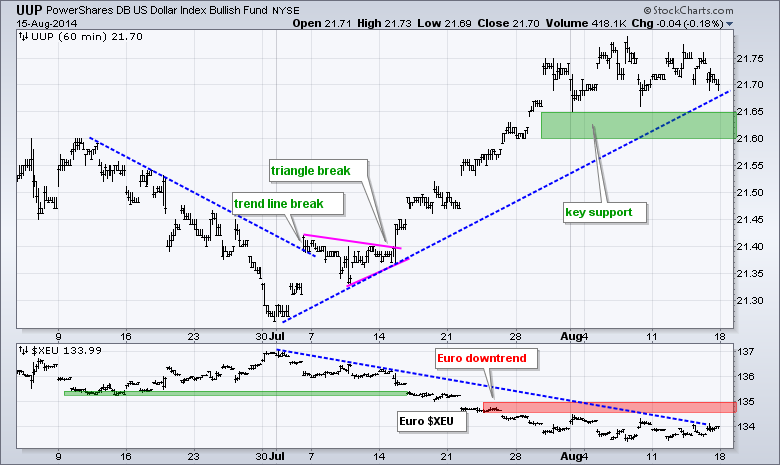
No change. The advance in UUP stalled over the last few days, but the overall up trend remains in place. The Dollar is in an uptrend with support in the 21.6-21.65 area. The Euro is in a downtrend with resistance at 135. I am hesitant to raise support for the UUP, but will remain bullish on the Dollar as long as the Euro holds below key resistance. Dollar strength could be negative for oil and gold.
**************************************************************
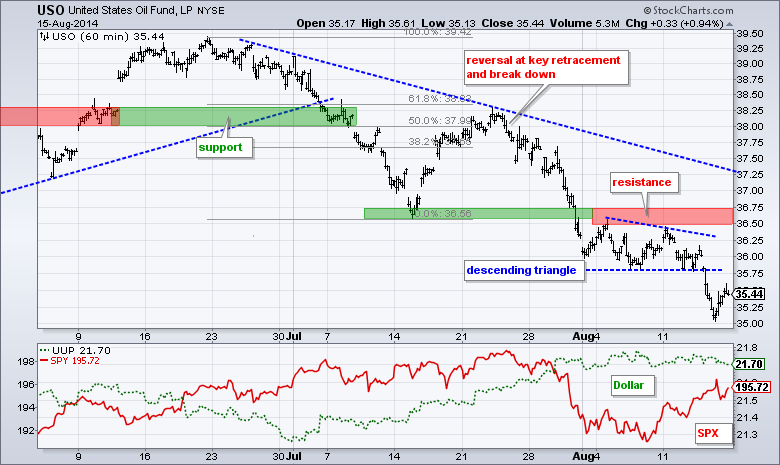
No change. USO broke down in late July, consolidated in early August and continued lower with a sharp decline below 35.50 last week. Ouch. There is simply no bid here. Broken support and the August highs mark key resistance in the 36.5-35.75 area.
**************************************************************
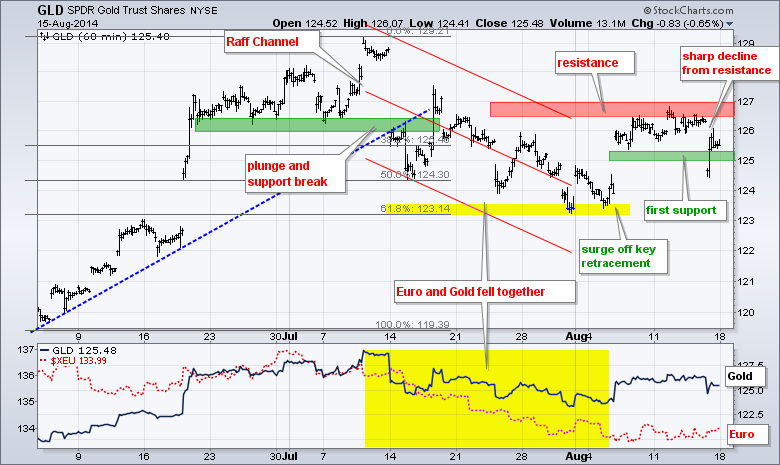
Gold finally backed down with a sharp decline on the open, but bounced on news reports of tension in Ukraine. I am going to ignore the spike below 125 and leave key support here. Resistance is still looking stiff and Friday's decline from resistance could be the start. Another break below 125 would be short-term bearish for gold.
***************************************************************
Key Reports and Events (all times Eastern):
Mon - Aug 18 - 10:00 - NAHB Housing Market Index
Tue - Aug 19 - 08:30 - Consumer Price Index (CPI)
Tue - Aug 19 - 08:30 - Housing Starts/Building Permits
Wed - Aug 20 - 07:00 - MBA Mortgage Index
Wed - Aug 20 - 10:30 - Crude Oil Inventories
Wed - Aug 20 - 14:00 - FOMC Minutes
Thu - Aug 21 - 08:30 - Initial Jobless Claims
Thu - Aug 21 - 10:00 - Existing Home Sales
Thu - Aug 21 - 10:00 - Philadelphia Fed
Thu - Aug 21 - 10:00 - Leading Economic Indicators
Thu - Aug 21 - 10:30 - Natural Gas Inventories
Fri - Aug 22 - 10:00 - Happy Friday!
This commentary and charts-of-interest are designed to stimulate thinking. This analysis is not a recommendation to buy, sell, hold or sell short any security (stock ETF or otherwise). We all need to think for ourselves when it comes to trading our own accounts. First, it is the only way to really learn. Second, we are the only ones responsible for our decisions. Think of these charts as food for further analysis. Before making a trade, it is important to have a plan. Plan the trade and trade the plan. Among other things, this includes setting a trigger level, a target area and a stop-loss level. It is also important to plan for three possible price movements: advance, decline or sideways. Have a plan for all three scenarios BEFORE making the trade. Consider possible holding times. And finally, look at overall market conditions and sector/industry performance.


