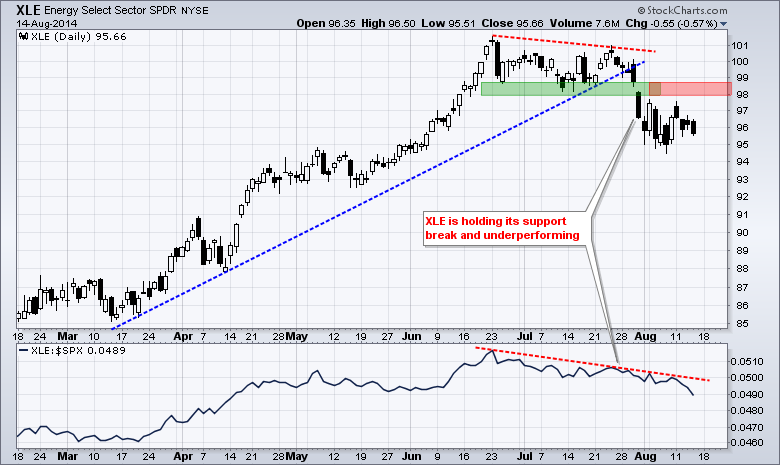
Stocks edged higher on Thursday with the major index ETFs scoring modest gains. The HealthCare SPDR (and the Utilities SPDR (XLU) led the sectors, while the Energy SPDR (XLE) lagged with a loss. Another break down in Spot Light Crude ($WTIC) weighed on the energy sector. The consumer discretionary sector showed some internal strength as the Home Construction iShares (ITB) surged 1.68% and the Retail SPDR (XRT) gained 1%. The Gold Miners ETF (GDX) fell back as gold failed to extend on its early August surge and remained in a five day consolidation. Biotechs led the healthcare sector higher with the Biotech iShares (IBB) gaining over 1.50%.
**This chart analysis is for educational purposes only, and should not
be construed as a recommendation to buy, sell or sell-short said securities**
**************************************************************
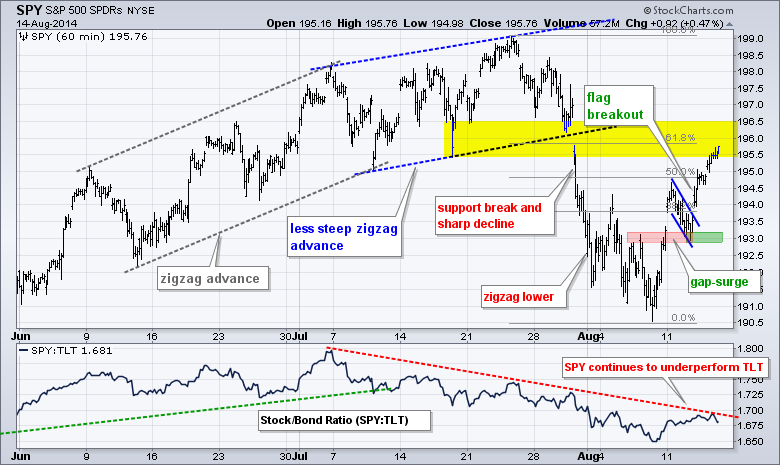
No change. SPY broke flag resistance with a surge on the open and closed strong. The gap and breakout are short-term bullish as long as they hold. I am going to mark support at the flag low in the 193 area. A move below 192.8 would reverse the short-term uptrend. SPY could see some resistance from the 62% retracement and broken support in the 196 area.
**************************************************************
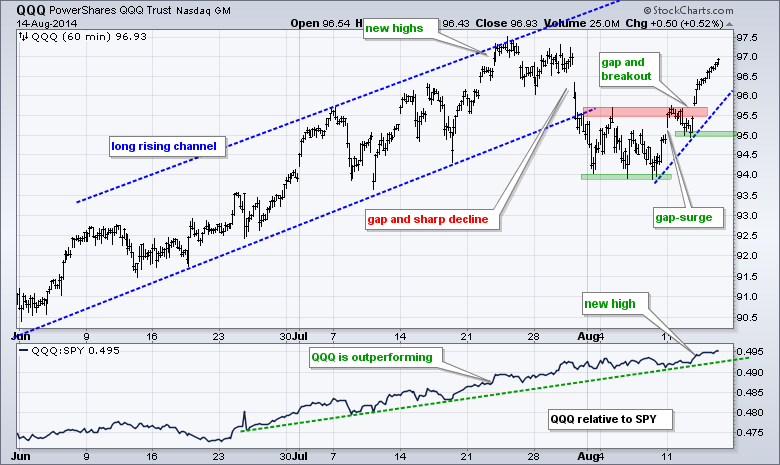
No change. QQQ gapped above resistance in the 95.5 area and closed strong. Tuesday's lows mark first support in the 95 area. The indicator window shows the QQQ:SPY ratio moving to a new high as QQQ outperforms.
**************************************************************
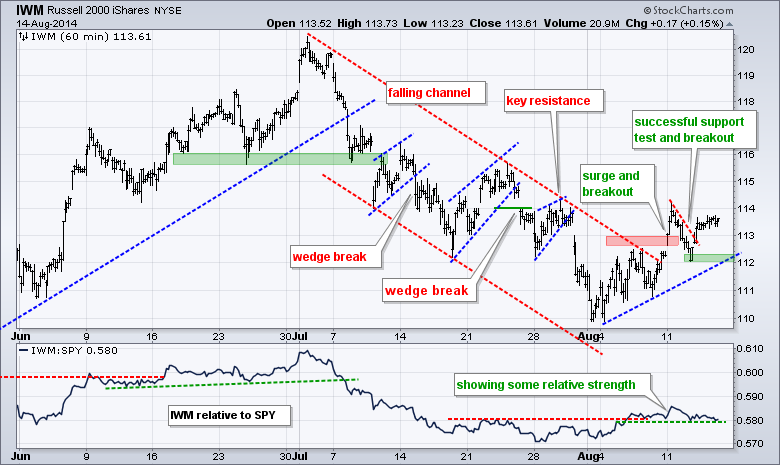
No change. IWM broke out with a surge above 113 last week, pulled back to the 112 area and bounced on Wednesday. This move affirms support in the 112 area. A move below 111.8 would break the August trend line and reverse the current upswing. The indicator window shows small-caps starting to lead as the IWM:SPY ratio rises in August.
**************************************************************
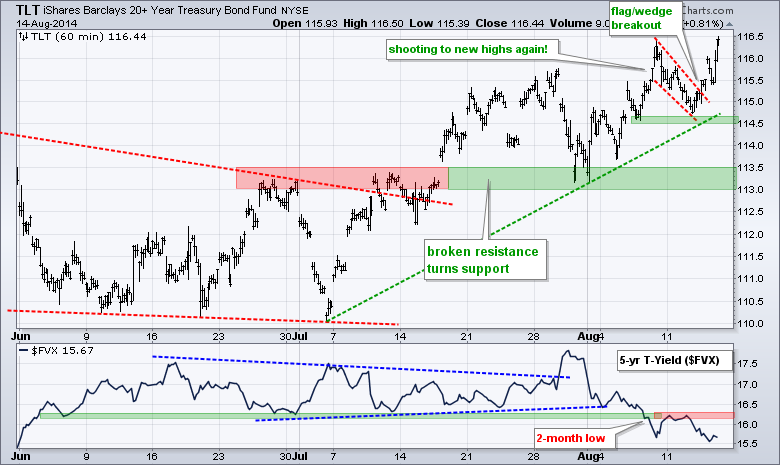
No change. TLT pulled back with a falling flag/wedge and then broke above the upper trend line with a surge on Wednesday. Long-term Treasuries continue to attract buying pressure. With this little breakout, chartists can mark first support at 114.5. I will leave key support in the 113-113.5 area for now.
**************************************************************
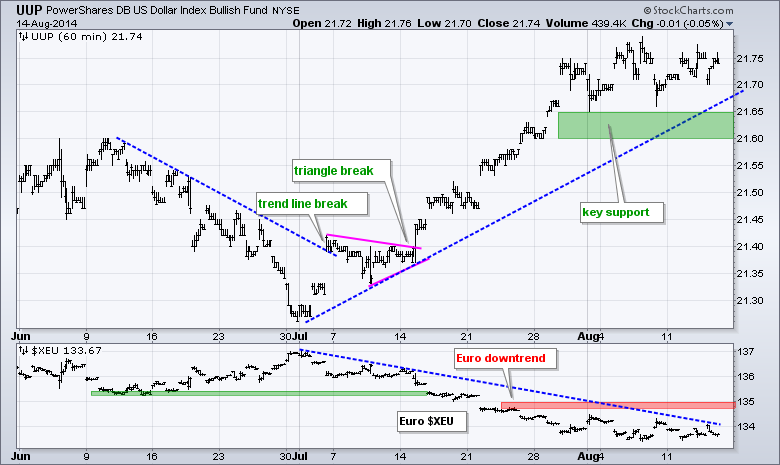
No change. The advance in UUP stalled over the last few days, but the overall up trend remains in place. The Dollar is in an uptrend with support in the 21.6-21.65 area. The Euro is in a downtrend with resistance at 135. I am hesitant to raise support for the UUP, but will remain bullish on the Dollar as long as the Euro holds below key resistance. Dollar strength could be negative for oil and gold.
**************************************************************
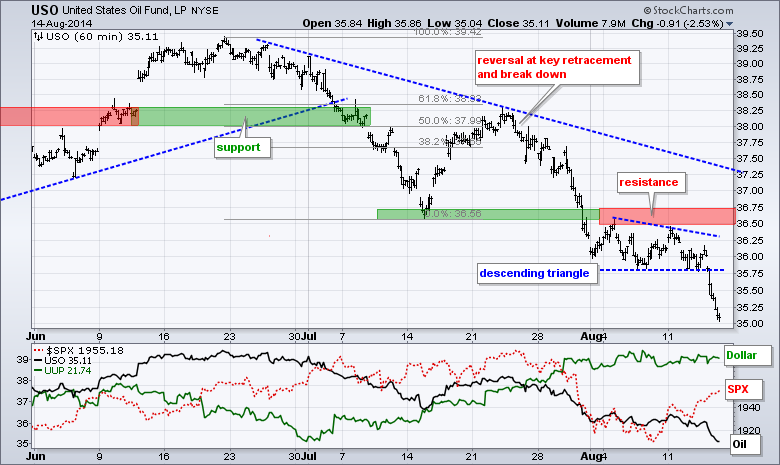
USO broke down in late July, consolidated in early August and continued lower with a sharp decline below 35.50 on Thursday. Ouch. There is simply no bid here. Broken support and the August highs mark key resistance in the 36.5-35.75 area.
**************************************************************
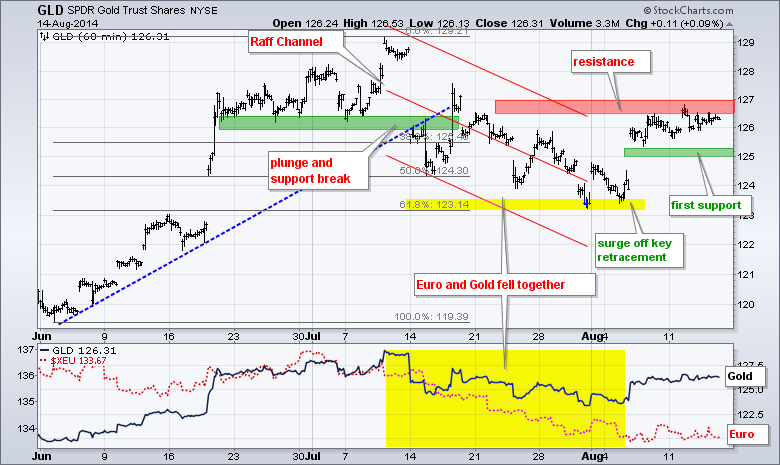
Gold is not backing down, nor is it breaking out. The Gold Miners ETF (GDX) is showing strength with a wedge breakout over the last few days. Note that gold held its gains even as the Euro remained weak. Any bounce in the Euro would likely trigger a breakout in GLD. I will set first support at 125 and traders can watch this level for signs of weakness.
***************************************************************
Key Reports and Events (all times Eastern):
Fri - Aug 15 - 08:30 - Producer Price Index (PPI)
Fri - Aug 15 - 08:30 - Empire State Manufacturing
Fri - Aug 15 - 09:15 - Industrial Production
Fri - Aug 15 - 09:55 - Michigan Sentiment
This commentary and charts-of-interest are designed to stimulate thinking. This analysis is not a recommendation to buy, sell, hold or sell short any security (stock ETF or otherwise). We all need to think for ourselves when it comes to trading our own accounts. First, it is the only way to really learn. Second, we are the only ones responsible for our decisions. Think of these charts as food for further analysis. Before making a trade, it is important to have a plan. Plan the trade and trade the plan. Among other things, this includes setting a trigger level, a target area and a stop-loss level. It is also important to plan for three possible price movements: advance, decline or sideways. Have a plan for all three scenarios BEFORE making the trade. Consider possible holding times. And finally, look at overall market conditions and sector/industry performance.


