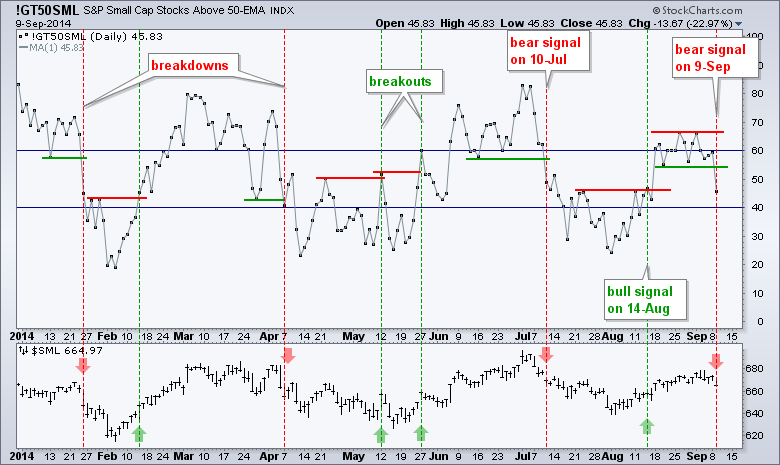
Stocks started the day weak and remained under selling pressure most of the day. Even though the overall declines were modest, price action was not positive and we could see more weakness. Also note that the Small-Cap Percent Above 50-day EMA (!GT50SML) broke down and triggered a bearish signal. In fact, breadth was pretty negative on Tuesday. S&P 500 AD Percent ($SPXADP) finished at -72%, S&P 400 Mid-Cap AD Percent ($MIDADP) hit -74% and S&P SmallCap AD Percent ($SMLADP) fell to -78%. Note that these were the most negative readings since late July. See the QQQ chart for an Apple target (indicator window).
**This chart analysis is for educational purposes only, and should not
be construed as a recommendation to buy, sell or sell-short said securities**
**************************************************************
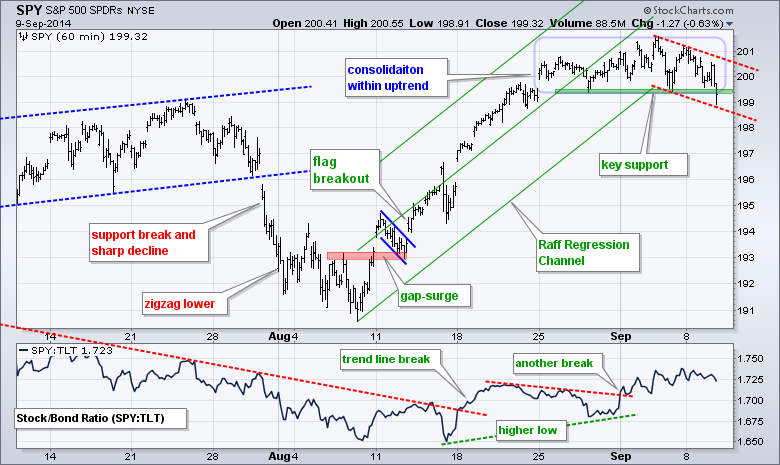
With a surge in negative breadth and a break below the late August low, I am moving towards a short-term bearish bias on SPY. The red lines show what could be a falling flag and I will mark first resistance at 201. The falling flag defines the short-term downtrend for now. I may be a bit early (i.e. wrong) on this call, but keep in mind that this is still viewed as a correction within a bigger uptrend.
**************************************************************
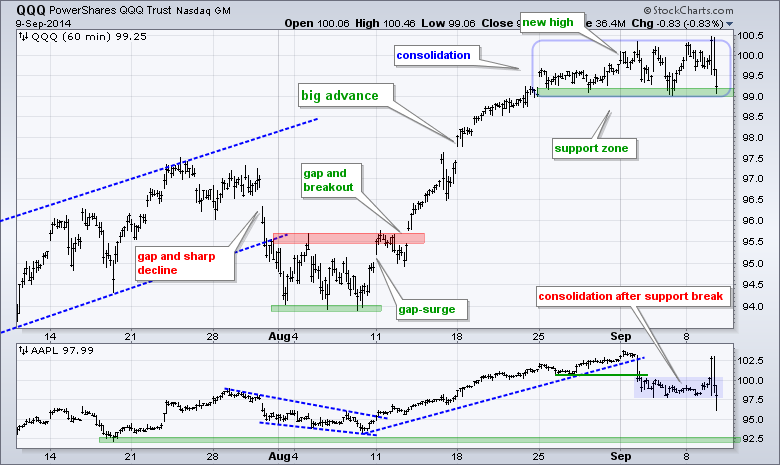
QQQ surged to 99.5 on 25-August and then moved into a consolidation with increasing volatility (swings). Tuesday's surge to 100.5 failed and the ETF traded down to support. A break would be short-term bearish and argue for a retracement of the prior advance. The indicator window shows Apple breaking support early last week and then consolidating. Note that I am basically ignoring the event driven pop-drop). Another break below 97.5 would be negative and Apple could then trade down to the next support zone in the 92.50 area. Separately, the Apple event was a bit of a let down. The watch does not inspire or work separately from an iPhone. The iPhone 6 does not have Sapphire glass. Apple's payment system only works with iPhone 6 and Apple is just a middleman taking a cut between the purchasers and the credit card.
**************************************************************
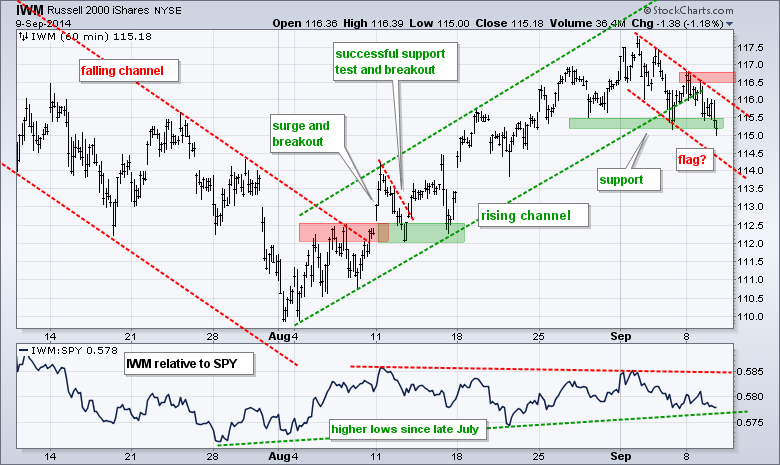
If we want to split hairs, IWM exceeded the late August low last week and exceeded last week's low on Tuesday. The ETF also broke the channel trend line and a downtrend is present in September. The red lines show a possible falling flag, but the trend is down as long as it falls. I will mark resistance at 116.8. Also notice that IWM has been underperforming this month.
**************************************************************
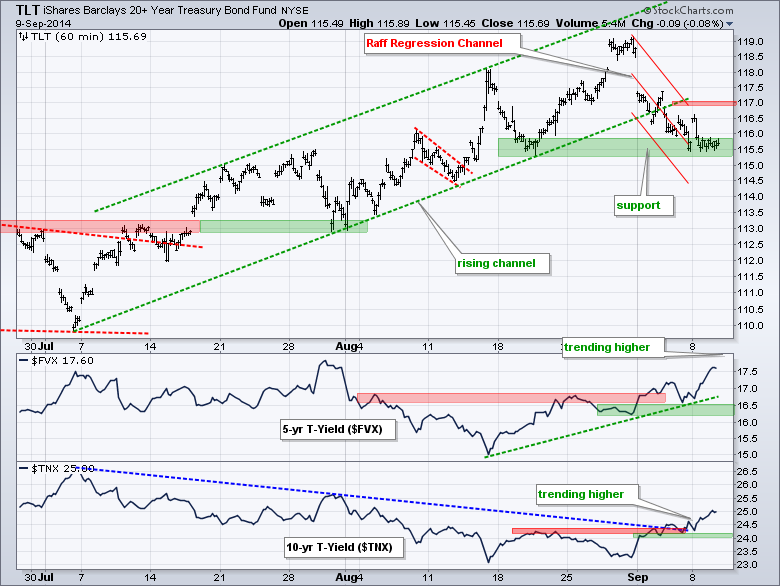
TLT is just sitting at support and waiting for a cue. Notice that the 5-year Treasury Yield ($FVX) moved above 1.75% and the 10-YR Treasury Yield ($TNX) hit 2.5%. Both are in uptrends and this suggest that TLT will break support and reverse the two month uptrend. The Raff Regression Channel defines the September downswing. Adding a buffer, a move above 117 would break downswing resistance and be bullish. Continued strength in long-term yields would steepen the yield curve and this could be positive for banks.
**************************************************************
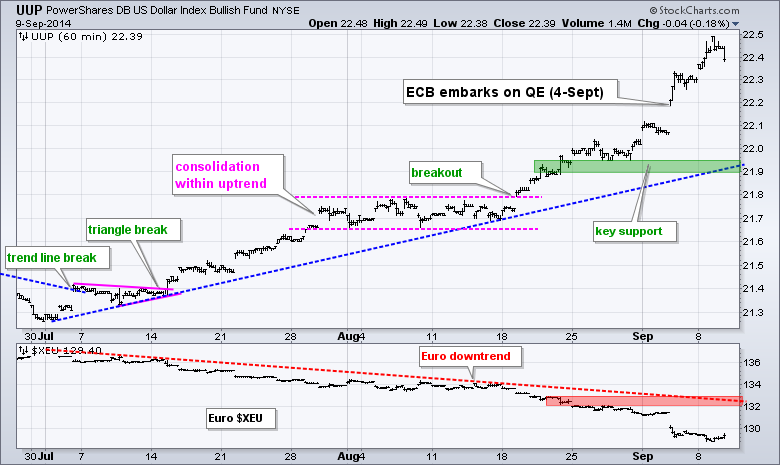
No change. Mark that date. On September 5th, 2014, the European Central Bank (ECB) embarked on quantitative easing. We have seen what happened to the Dollar during QE and it is now the Euro's turn (and the Yen). The US is winding down QE, while the other two are ramping up. The Euro Index ($XEU) plunged over 1% and hit a fresh 52-week low. Key support is set at 21.90.
**************************************************************
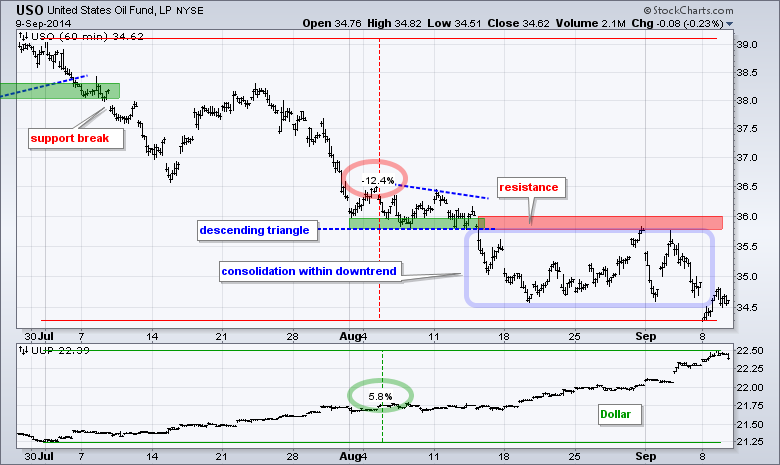
No change. The USO Oil Fund (USO) is down over 10% from its early July high and the US Dollar ETF (UUP) is over 5% during this same timeframe. It is clear that a strong Dollar is hurting oil. In addition, new supply from fracking is outpacing any increase in demand. On the price chart, USO is consolidating within a downtrend and this favors a continuation lower. The ETF failed at its resistance zone twice and it would take a move above 36 to reverse the short-term downtrend.
**************************************************************
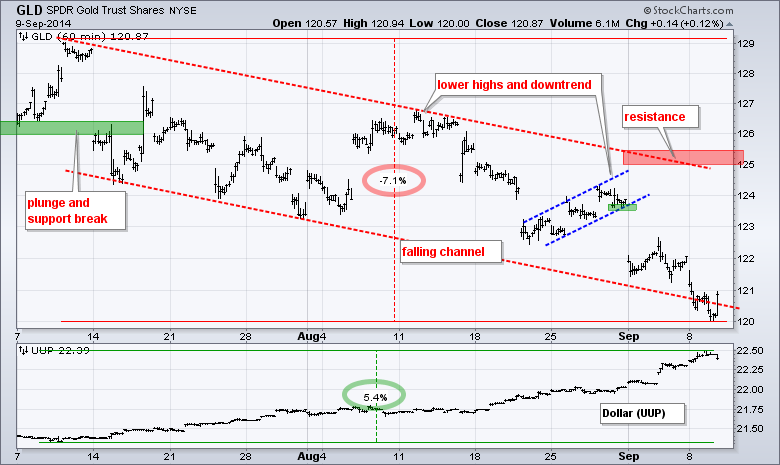
No change. A strong Dollar is also weighing on gold because the Gold SPDR (GLD) is down over 6% from its early July high. Gold may be short-term oversold and the Dollar may be short-term overbought, but the trends are clear. The chart shows GLD within a falling channel the last two months. The lower trend line extends to the 120 area later this month. The upper trend line and a small buffer mark key resistance in the 125-125.5 area.
***************************************************************
Key Reports and Events (all times Eastern):
Wed - Sep 10 - 07:00 - MBA Mortgage Index
Wed - Sep 10 - 10:30 - Crude Oil Inventories
Thu - Sep 11 - 08:30 - Initial Jobless Claims
Thu - Sep 11 - 10:30 - Natural Gas Inventories
Fri - Sep 12 - 08:30 - Retail Sales
Fri - Sep 12 - 09:55 - Michigan Sentiment
Thu - Sep 18 - 09:00 - Scottish Referendum
Chart Setups on Tuesday and Thursday.
This commentary and charts-of-interest are designed to stimulate thinking. This analysis is not a recommendation to buy, sell, hold or sell short any security (stock ETF or otherwise). We all need to think for ourselves when it comes to trading our own accounts. First, it is the only way to really learn. Second, we are the only ones responsible for our decisions. Think of these charts as food for further analysis. Before making a trade, it is important to have a plan. Plan the trade and trade the plan. Among other things, this includes setting a trigger level, a target area and a stop-loss level. It is also important to plan for three possible price movements: advance, decline or sideways. Have a plan for all three scenarios BEFORE making the trade. Consider possible holding times. And finally, look at overall market conditions and sector/industry performance.


