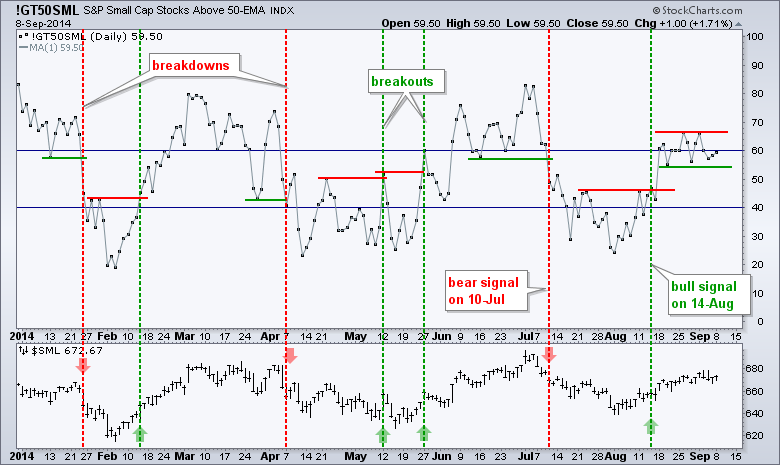
It was a mixed day on Wall Street. The Nasdaq 100 ETF (QQQ) edged higher, while the S&P 500 SPDR (SPY) and Russell 2000 iShares (IWM) edged lower. The gains and losses were fractional. The Energy SPDR (XLE) was high hard as Spot Light Crude ($WTIC) fell to $92 in early trading. The technology sector provided a bright spot as the Internet ETF (FDN) and Networking iShares (IGN) gained around .80% on the day. Also note that the Broker-Dealer iShares (IAI) closed modestly higher. Metals and mining stocks were hit hard as the Metals & Mining SPDR (XME) fell 1.80%, the Gold Miners ETF (GDX) plunged 3.5% and the Steel ETF (SLX) fell 1.63%. The chart below shows the Small-Cap Percent Above 50-day EMA (!GT50SML) hovering in the 60% area. This indicator has a clear bullish bias as long as it holds up. A moment-of-truth could be here. Either the indicator breaks out above 68 and small-caps outperform or the indicator breaks below 54 and IJR reverses its short-term uptrend. BAC, CSTE, CY and MLY charts at the end of the commentary.
**This chart analysis is for educational purposes only, and should not
be construed as a recommendation to buy, sell or sell-short said securities**
**************************************************************
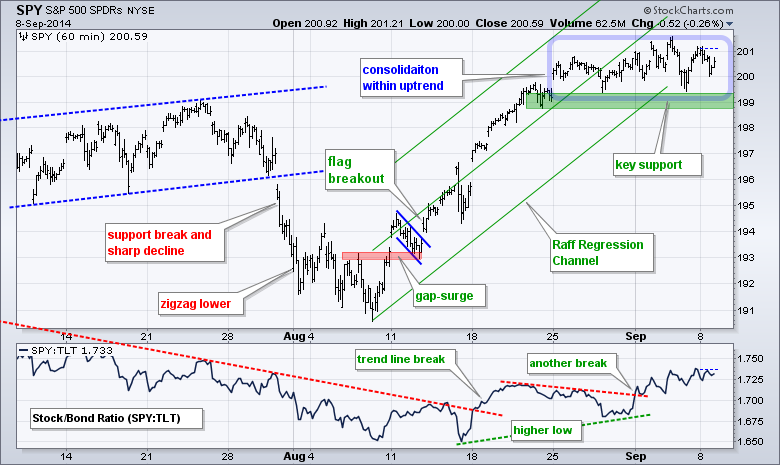
No change. SPY surged from 191 to 200 in August and then embarked on a consolidation (blue outline). This is a consolidation within an uptrend, which means a continuation higher is expected. The ETF has now bounced off support in the 199 area twice. A move below 198.5 would break support and reverse the short-term uptrend. Even though this would be short-term negative, I would be careful because the bigger trend is still up. The indicator window shows SPY starting to outperform TLT as the price relative (SPY:TLT ratio) moves to its highest level since late July.
**************************************************************
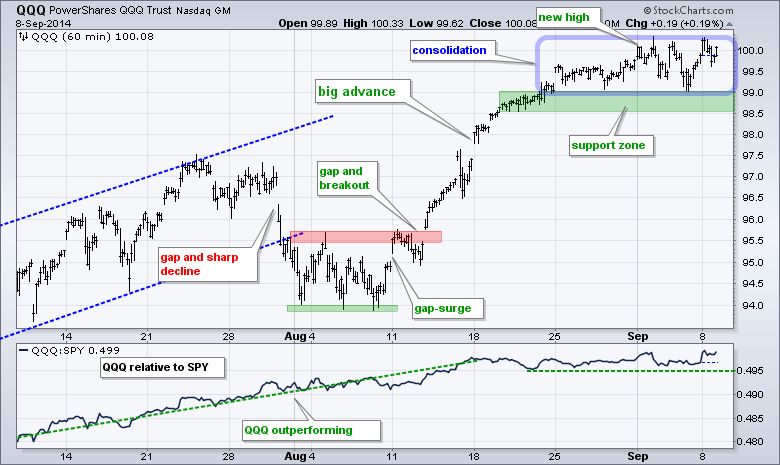
No change. QQQ surged from 94 to 99.5 in August and then embarked on a consolidation the last two weeks. The ETF bounced off the upper end of its support zone twice. I could set support at 99, but I prefer to use buffers, especially when the bigger trend is up. A move below 98.5, therefore, would be enough to reverse this short-term uptrend. The indicator window shows the price relative moving to a new high in mid August and then trading flat the last few weeks. Note that Apple is holding an event on Tuesday and Apple accounts for 13% of QQQ.
**************************************************************
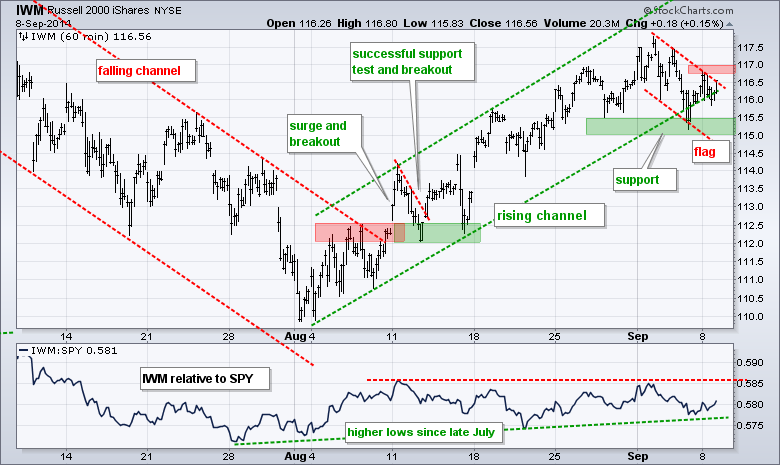
IWM remains a conundrum of sorts, but I still have a bullish bias on this small-cap ETF. The short-term trend is clearly up since early August. The ETF fell back to the 115.5 area with a falling flag of sorts. A break above 117 would end this short pullback and signal a continuation higher. Key support remains in the 115-115.5 area. The indicator window shows IWM relative to SPY (IWM:SPY ratio). Higher lows formed since late July, but we have yet to see a breakout that would signal some serious relative strength.
**************************************************************
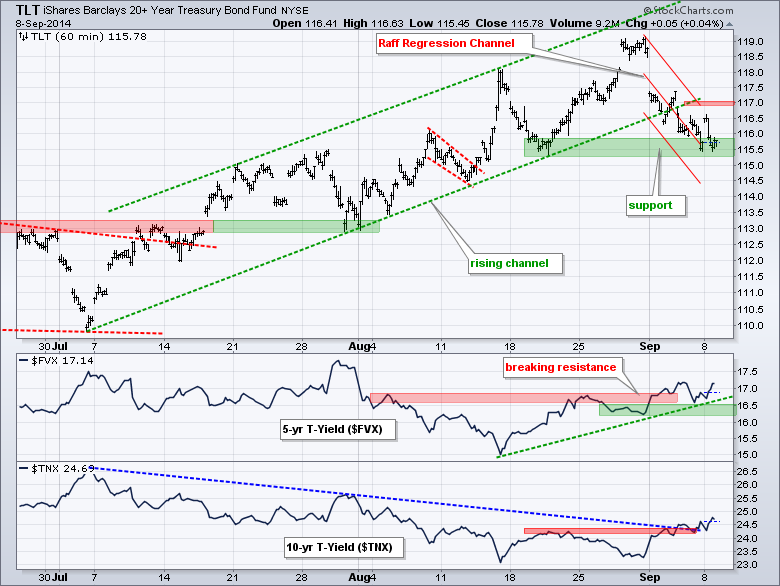
No change. Even though non-farm payrolls were well below expectations, the 20+ YR T-Bond ETF (TLT) moved lower on Friday. Say what? This was certainly not expected. Treasuries should rally on a weak number. The inability to rally in the face of bullish news is a negative for Treasuries. Even so, the chart shows TLT at support in the 115.50 area. The red lines mark a Raff Regression Channel extending down from the late August high. A move above 117 would reverse this downswing and keep the bigger uptrend alive. The indicator windows show the 5-year Treasury Yield ($FVX) in an uptrend since mid August and the 10-YR Treasury Yield ($TNX) breaking out last week. These moves suggest that TLT will break support.
**************************************************************
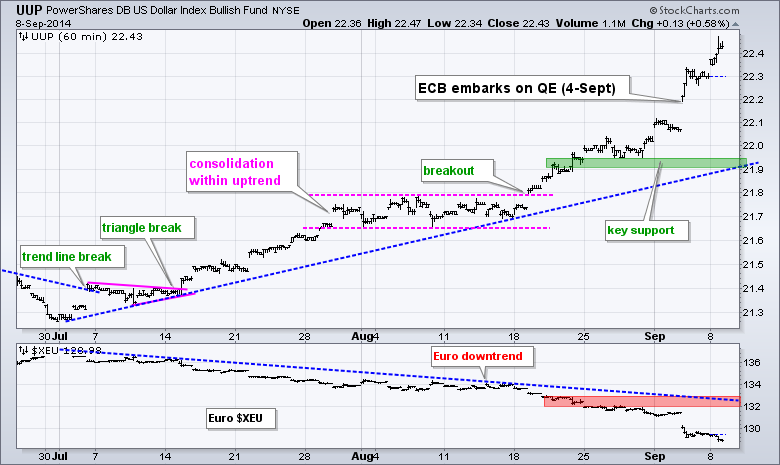
No change. Mark that date. On September 5th, 2014, the European Central Bank (ECB) embarked on quantitative easing. We have seen what happened to the Dollar during QE and it is now the Euro's turn (and the Yen). The US is winding down QE, while the other two are ramping up. The Euro Index ($XEU) plunged over 1% and hit a fresh 52-week low. Key support is set at 21.90.
**************************************************************
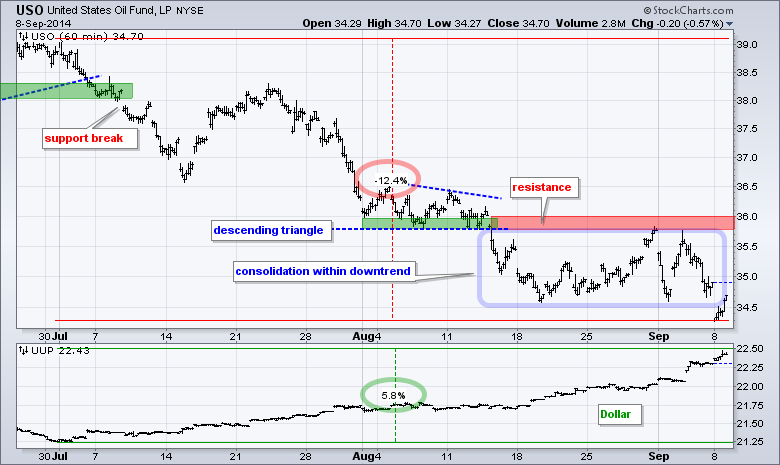
No change. The USO Oil Fund (USO) is down over 10% from its early July high and the US Dollar ETF (UUP) is over 5% during this same timeframe. It is clear that a strong Dollar is hurting oil. In addition, new supply from fracking is outpacing any increase in demand. On the price chart, USO is consolidating within a downtrend and this favors a continuation lower. The ETF failed at its resistance zone twice and it would take a move above 36 to reverse the short-term downtrend.
**************************************************************
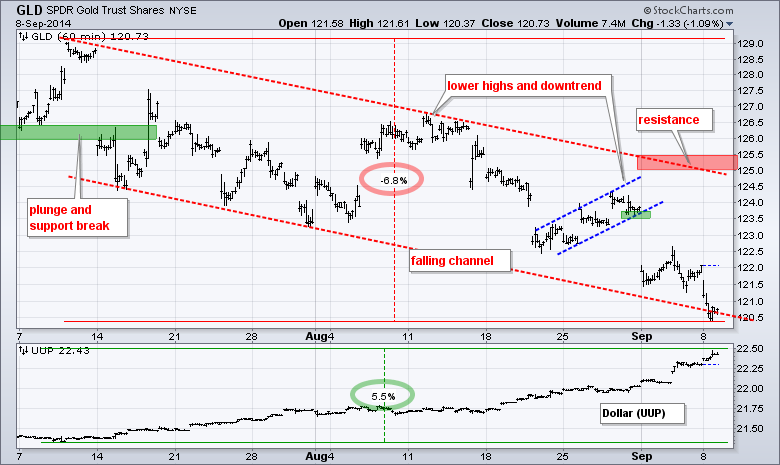
No change. A strong Dollar is also weighing on gold because the Gold SPDR (GLD) is down over 6% from its early July high. Gold may be short-term oversold and the Dollar may be short-term overbought, but the trends are clear. The chart shows GLD within a falling channel the last two months. The lower trend line extends to the 120 area later this month. The upper trend line and a small buffer mark key resistance in the 125-125.5 area.
***************************************************************
Key Reports and Events (all times Eastern):
Mon - Sep 08 - 15:00 - Consumer Credit
Tue - Sep 09 - 10:00 - JOLTS - Job Openings
Wed - Sep 10 - 07:00 - MBA Mortgage Index
Wed - Sep 10 - 10:30 - Crude Oil Inventories
Thu - Sep 11 - 08:30 - Initial Jobless Claims
Thu - Sep 11 - 10:30 - Natural Gas Inventories
Fri - Sep 12 - 08:30 - Retail Sales
Fri - Sep 12 - 09:55 - Michigan Sentiment
Thu - Sep 18 - 09:00 - Scottish Referendum
Chart Setups on Tuesday and Thursday.
This commentary and charts-of-interest are designed to stimulate thinking. This analysis is not a recommendation to buy, sell, hold or sell short any security (stock ETF or otherwise). We all need to think for ourselves when it comes to trading our own accounts. First, it is the only way to really learn. Second, we are the only ones responsible for our decisions. Think of these charts as food for further analysis. Before making a trade, it is important to have a plan. Plan the trade and trade the plan. Among other things, this includes setting a trigger level, a target area and a stop-loss level. It is also important to plan for three possible price movements: advance, decline or sideways. Have a plan for all three scenarios BEFORE making the trade. Consider possible holding times. And finally, look at overall market conditions and sector/industry performance.


