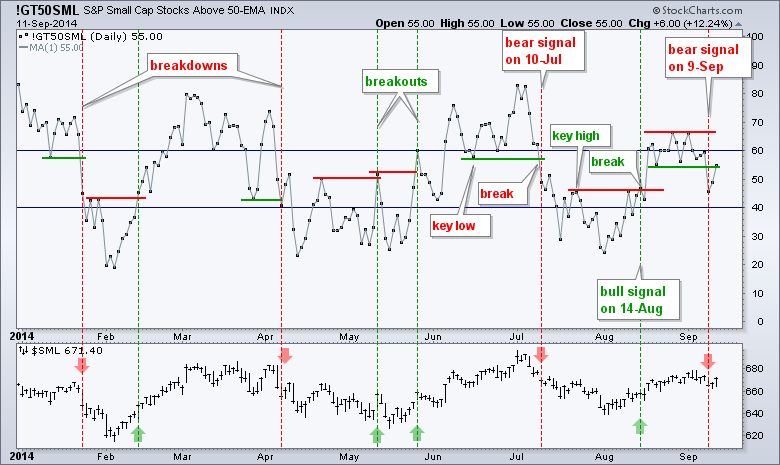
Stocks were mixed on Thursday with the Russell 2000 iShares (IWM) moving higher and the Dow Diamonds (DIA) edging lower. Strength in financial services helped the Russell 2000 gain. The Regional Bank SPDR (KRE) gained .81% as the 10-YR Treasury Yield ($TNX) continued higher. The Retail SPDR (XRT) also showed some upside leadership with a .87% gain. Retail Sales for August will be reported before the market open. Elsewhere, the Networking iShares (IGN) surged over 1% and the Telecom iShares (IYZ) was up 1.05%. The recovery in small-caps was quite strong as the Small-Cap Percent Above 50-day EMA (!GT50SML) surge back above its support break. A follow through above 60 would completely negate the bearish signal that I identified earlier this week. Note that these signals are based on perceived trend changes in the indicator. A key low forms with a dip below 60 and bounce back above. A subsequent break of this low signals weakening breadth. A key high forms with a bounce above 40 and dip back below. A subsequent break above this high signals strengthening breadth. The signals are a bit subjective and should be confirmed with basic chart analysis. The bearish signal from 9-Sep was valid as long as IWM and IJR held their falling flag patterns. Also keep in mind that stocks are in long-term uptrends and declines are likely to be short lived.
**This chart analysis is for educational purposes only, and should not
be construed as a recommendation to buy, sell or sell-short said securities**
**************************************************************
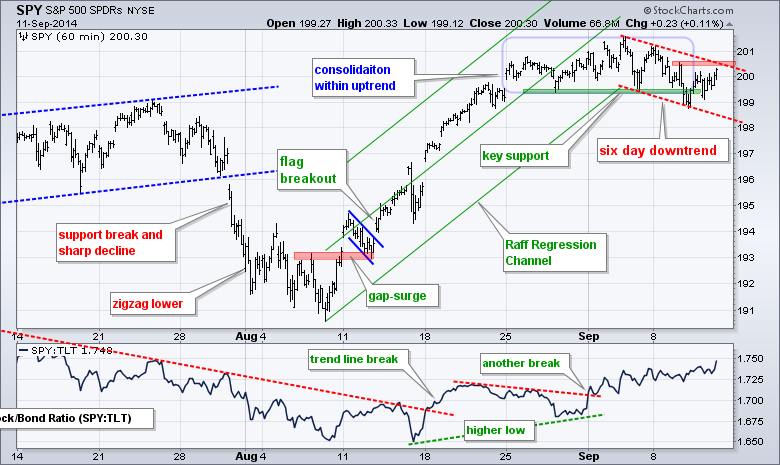
No change. SPY has a series of lower lows and lower highs working over the last six days. It is a very short-term trend, but it is down until proven otherwise. The red lines show what could be a falling flag and I will mark first resistance at 200.60. Keep in mind that this is still viewed as a correction within a bigger uptrend. The indicator window shows SPY outperforming TLT since mid August.
**************************************************************
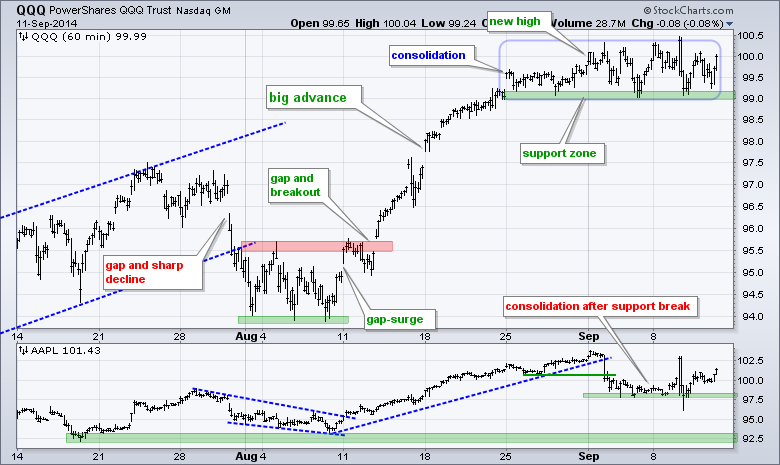
No change. QQQ bounced off its support zone as Apple moved back above 100. These bounces reinforce both support zones. A move below 99 would be short-term bearish for QQQ and a move below 97.5 would be short-term bearish for Apple. At a 13% weighting, Apple holds an important key for QQQ. A break below 97.5 would target a move to 92.5, which would be around 5%. This would weigh on QQQ.
**************************************************************
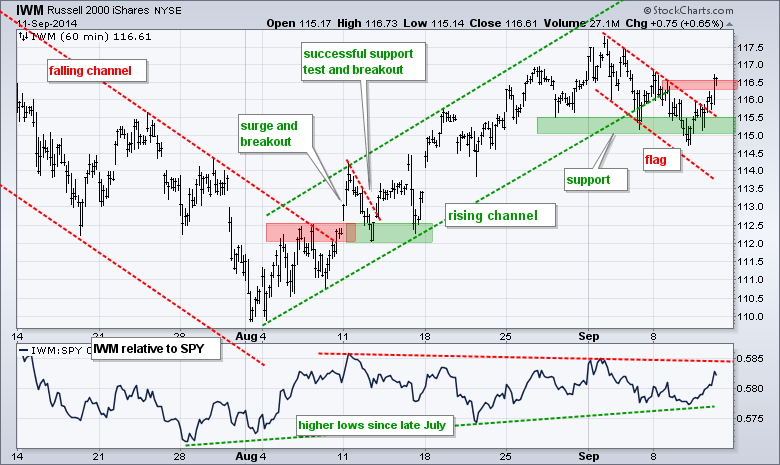
Led by the financial services sector, which accounts for around 23%, the Russell 2000 iShares (IWM) broke the flag trend line and exceeded first resistance. IWM also outperformed SPY over the last few days. The breakout is bullish until proven otherwise and I will mark first support at 115.
**************************************************************
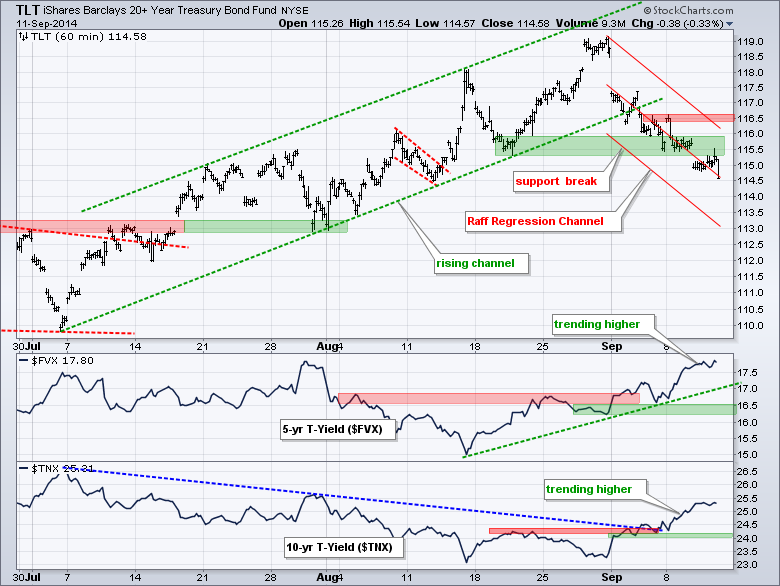
No change. TLT broke support to fully reverse the two month uptrend. Similarly, the 5-year Treasury Yield ($FVX) and 10-YR Treasury Yield ($TNX) continued higher. Remember, yields move opposite of prices. The upside breakouts in yields are bearish for Treasuries. While this may weigh on stocks short-term, I think it will be long-term positive because the money moving out of Treasuries has to go somewhere. TLT resistance is set at 116.6.
**************************************************************
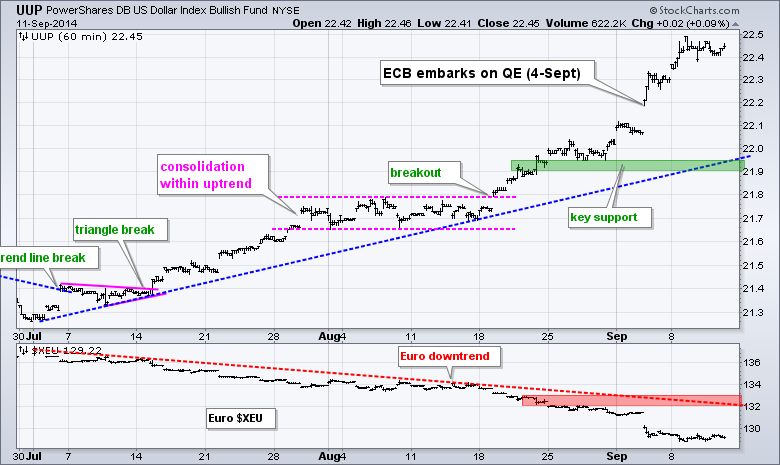
No change. Mark that date. On September 5th, 2014, the European Central Bank (ECB) embarked on quantitative easing. We have seen what happened to the Dollar during QE and it is not the Euro's turn (and the Yen). The US is winding down QE, while the other two are ramping up. The Euro Index ($XEU) plunged over 1% and hit a fresh 52-week low. Key support is set at 21.90.
**************************************************************
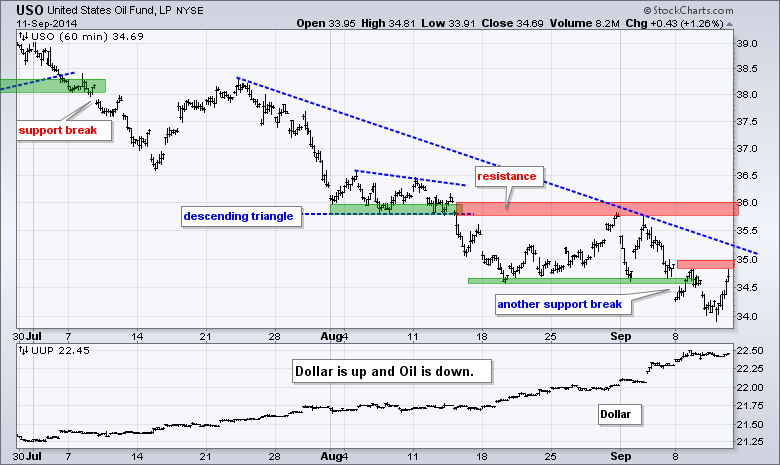
No change. The USO Oil Fund (USO) broke yet another support level and hit a new low for the move. This week's high marks first resistance at 35. A quick move above this level would suggest a bear trap, but it would not be enough to reverse the overall downtrend. I am keeping key resistance at 36. Strength in the Dollar is contributing to weakness in oil.
**************************************************************
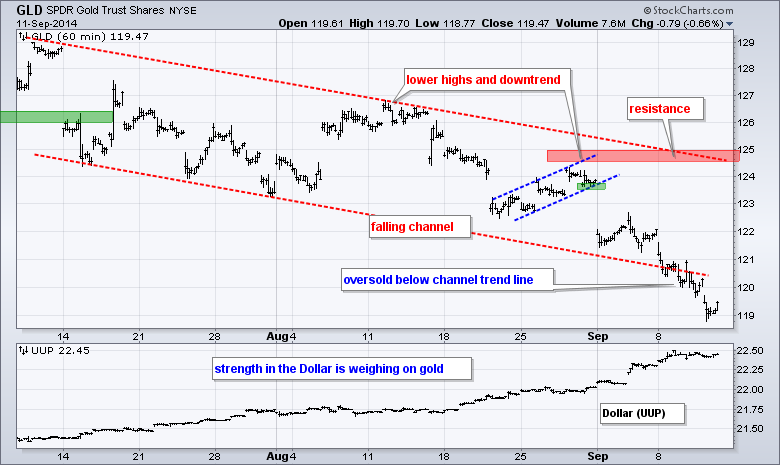
No change. The Gold SPDR (GLD) moved below the lower trend line of a falling channel that extends back to mid July. This oversold condition is about the only positive for gold. Also note that the Euro is also oversold. Oversold conditions do not guarantee a bounce though. In fact, oversold conditions occur in strong downtrends and any bounce would be deemed temporary. Overall, I will stick to the channel and mark key resistance at 125.
***************************************************************
Key Reports and Events (all times Eastern):
Fri - Sep 12 - 08:30 - Retail Sales
Fri - Sep 12 - 09:55 - Michigan Sentiment
Thu - Sep 18 - 09:00 - Scottish Referendum
Chart Setups on Tuesday and Thursday.
This commentary and charts-of-interest are designed to stimulate thinking. This analysis is not a recommendation to buy, sell, hold or sell short any security (stock ETF or otherwise). We all need to think for ourselves when it comes to trading our own accounts. First, it is the only way to really learn. Second, we are the only ones responsible for our decisions. Think of these charts as food for further analysis. Before making a trade, it is important to have a plan. Plan the trade and trade the plan. Among other things, this includes setting a trigger level, a target area and a stop-loss level. It is also important to plan for three possible price movements: advance, decline or sideways. Have a plan for all three scenarios BEFORE making the trade. Consider possible holding times. And finally, look at overall market conditions and sector/industry performance.


