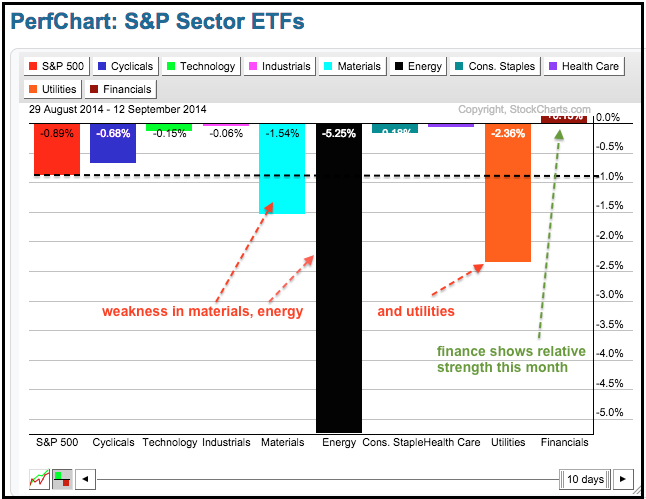
It is Fed week and stocks are in corrective mode. IWM and SPY edged lower this month, while QQQ has traded flat since late August. The patterns for SPY and IWM look like falling flags, which are bullish continuation patterns. Breakouts in both would be quite bullish for the market overall. It could be a volatile week for Treasuries because the Fed makes its policy statement on Wednesday. The 20+ YR T-Bond ETF (TLT) suffered its biggest weekly decline since August 2013 and its largest two week decline since November 2013. The 10-YR Treasury Yield ($TNX) surged above 2.6% and to its highest level since early July. The rise in long-term Treasury yields boosted the Regional Bank SPDR (KRE), but weighed on the Utilities SPDR (XLU) and the REIT iShares (IYR) last week. As the PerfChart below shows, the Finance SPDR (XLF) is the only sector with a gain this month. The Industrials SPDR (XLI) and Technology SPDR (XLK) sport very small losses and show relative strength because they are down less than SPY.
**This chart analysis is for educational purposes only, and should not
be construed as a recommendation to buy, sell or sell-short said securities**
**************************************************************
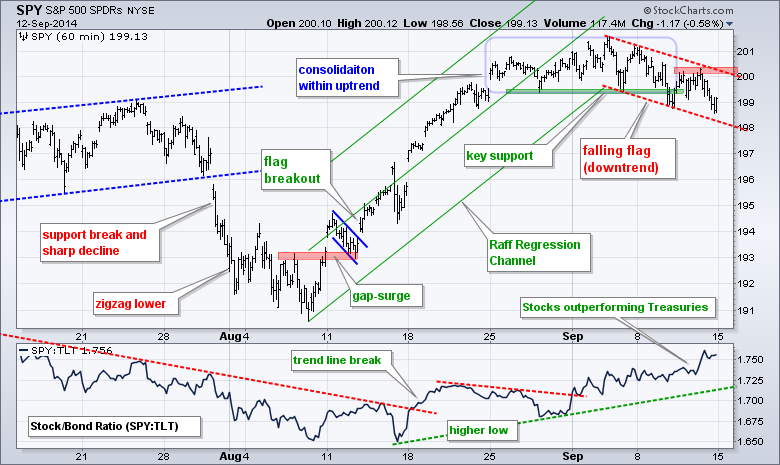
SPY peaked above 201 in early September and worked its way lower with a move to the 199 area. The downswing looks like a falling flag, which is a bullish continuation pattern. The upper trend line, Thursday's peak and a small buffer mark resistance at 200.50. A breakout here would signal an end to the correction and a resumption of the uptrend. The indicator window shows SPY outperforming TLT since mid August. This is positive for stocks.
**************************************************************
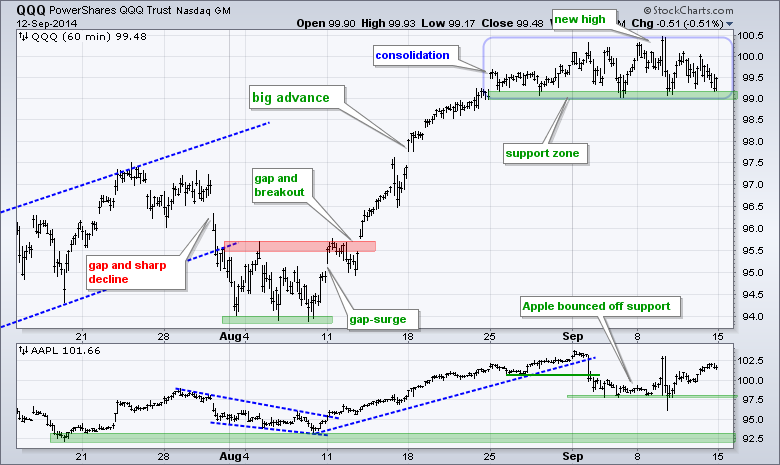
Apple bounced off support as the iPhone 6 sold out across the country. QQQ also held support, but did not get much of a bounce. Nothing has really changed on this chart. QQQ remains in a consolidation after the sharp August advance. Technically, a consolidation within an uptrend is a bullish continuation pattern. A break below the September lows would suggest otherwise and signal the start of a correction.
**************************************************************
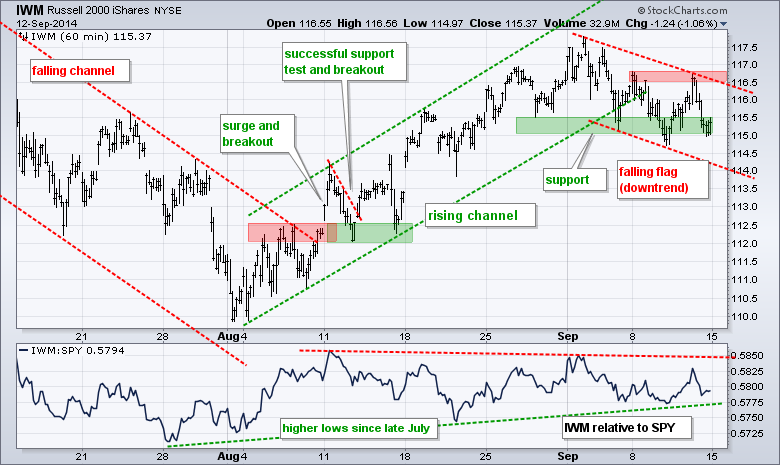
IWM surged to 116.5 on Thursday and then dropped back to the support zone on Friday. Given the failure at Monday's high, it looks like the downswing rules for now. The September decline looks like a falling flag with resistance set at 116.8. I think that both SPY and IWM need breakouts to make for a sustainable reversal.
**************************************************************
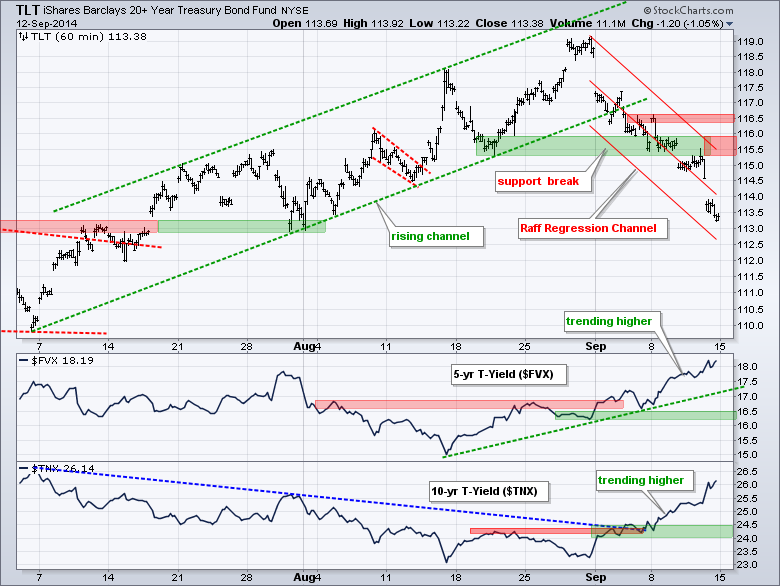
TLT broke support with a sharp decline this month. Even though the ETF is short-term oversold after a 4+ percent decline, the short-term trend is down and I am marking key resistance in the 116.5 area. Further down, we could see an oversold bounce back to broken support in the 115.5 area. The indicator windows show the 5-year Treasury Yield ($FVX) moving above its July high and the 10-YR Treasury Yield ($TNX) moving above 2.6%.
**************************************************************
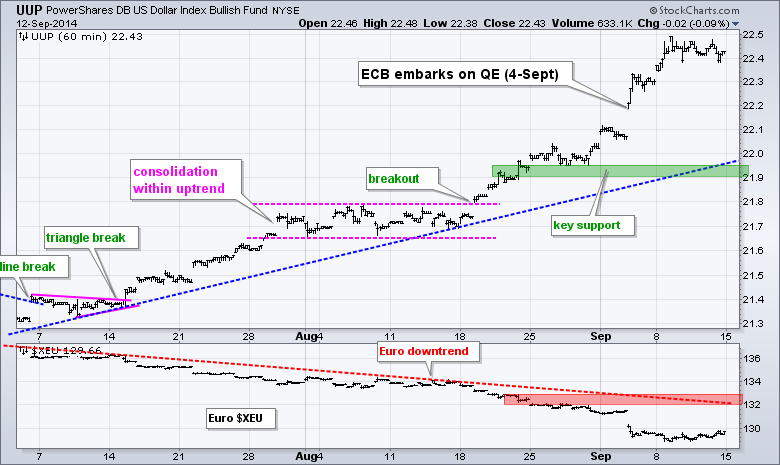
No change. Mark that date. On September 5th, 2014, the European Central Bank (ECB) embarked on quantitative easing. We have seen what happened to the Dollar during QE and it is not the Euro's turn (and the Yen). The US is winding down QE, while the other two are ramping up. The Euro Index ($XEU) plunged over 1% and hit a fresh 52-week low. Key support is set at 21.90.
**************************************************************
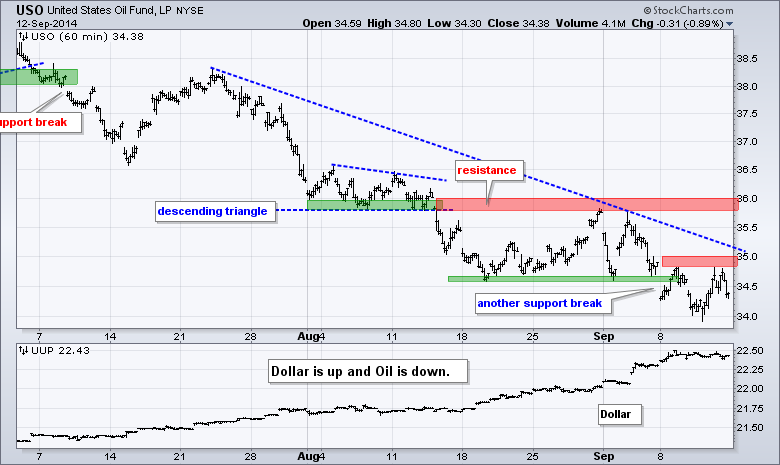
No change. The USO Oil Fund (USO) broke yet another support level and hit a new low for the move. Last week's highs mark first resistance in the 35 area. A quick move above this level would suggest a bear trap, but it would not be enough to reverse the overall downtrend. I am keeping key resistance at 36. Strength in the Dollar is contributing to weakness in oil.
**************************************************************
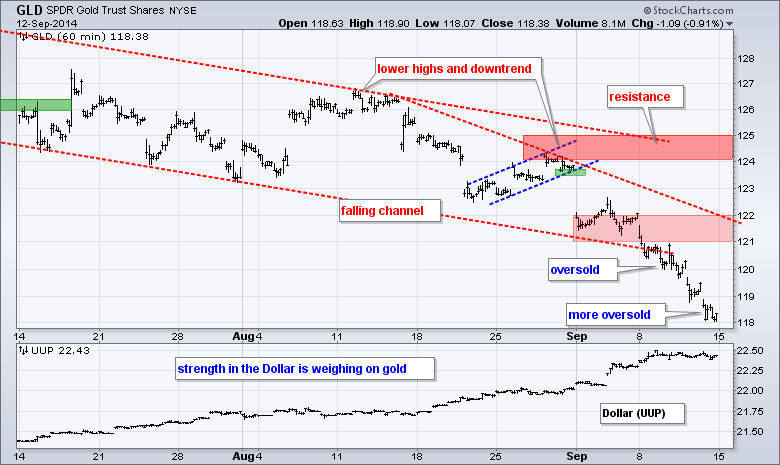
The Gold SPDR (GLD) started the week oversold and near the lower trend line of the falling channel. GLD ended the week even more oversold and well below the channel trend line. This is a classic case of becoming oversold and remaining oversold. If having to pick first resistance, I would user the early September lows and the mid August trend line to mark it in the 121-122 area. I will mark key resistance at 125.
***************************************************************
Key Reports and Events (all times Eastern):
Mon - Sep 15 - 08:30 - Empire State Manufacturing
Mon - Sep 15 - 09:15 - Industrial Production
Tue - Sep 16 - 08:30 - Producer Price Index (PPI)
Wed - Sep 17 - 07:00 - MBA Mortgage Index
Wed - Sep 17 - 08:30 - Consumer Price Index (CPI)
Wed - Sep 17 - 08:30 - Current Account Balance
Wed - Sep 17 - 10:00 - NAHB Housing Market Index
Wed - Sep 17 - 10:30 - Crude Oil Inventories
Wed - Sep 17 - 14:00 - FOMC Policy Statement
Thu - Sep 18 - 08:30 - Initial Jobless Claims
Thu - Sep 18 - 08:30 - Housing Starts/Building Permits
Thu - Sep 18 - 10:00 - Philadelphia Fed
Thu - Sep 18 - 10:30 - Natural Gas Inventories
Thu - Sep 18 - 09:00 - Scottish Referendum
Fri - Sep 19 - 10:00 - Leading Economic Indicators
Chart Setups on Tuesday and Thursday.
This commentary and charts-of-interest are designed to stimulate thinking. This analysis is not a recommendation to buy, sell, hold or sell short any security (stock ETF or otherwise). We all need to think for ourselves when it comes to trading our own accounts. First, it is the only way to really learn. Second, we are the only ones responsible for our decisions. Think of these charts as food for further analysis. Before making a trade, it is important to have a plan. Plan the trade and trade the plan. Among other things, this includes setting a trigger level, a target area and a stop-loss level. It is also important to plan for three possible price movements: advance, decline or sideways. Have a plan for all three scenarios BEFORE making the trade. Consider possible holding times. And finally, look at overall market conditions and sector/industry performance.


