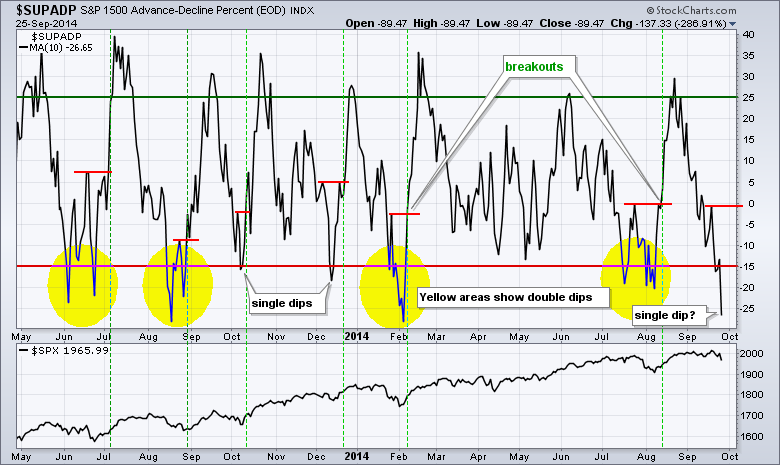
Stocks were hit with broad selling pressure with the Nasdaq 100 ETF. leading the major index ETFs lower. The Technology SPDR led the sectors lower with a 2+ percent loss. Almost all industry group ETFs were down. The Gold Miners ETF managed a modest gain and gold got a bounce. The US Gasoline ETF and the Natural Gas ETF also bucked the selling pressure. The chart below shows the 10-day SMA for AD Percent for the S&P 1500. The indicator is deemed oversold when below -15% and it fell below -25% on Thursday, which is way oversold. At this point, I would consider it both oversold and bearish. Remember, stocks can become oversold and remain oversold. Given the depth of the dip and the seasonal patterns (Sep-Oct), I would expect a double dip type signal for this breadth indicator. This means we could see an oversold bounce back above -15% and a second move into oversold territory. This would provide a setup and a break above the intermittent peak would trigger a bullish signal. For now though, stocks are in corrective mode and the short-term trends are down.
**This chart analysis is for educational purposes only, and should not
be construed as a recommendation to buy, sell or sell-short said securities**
**************************************************************
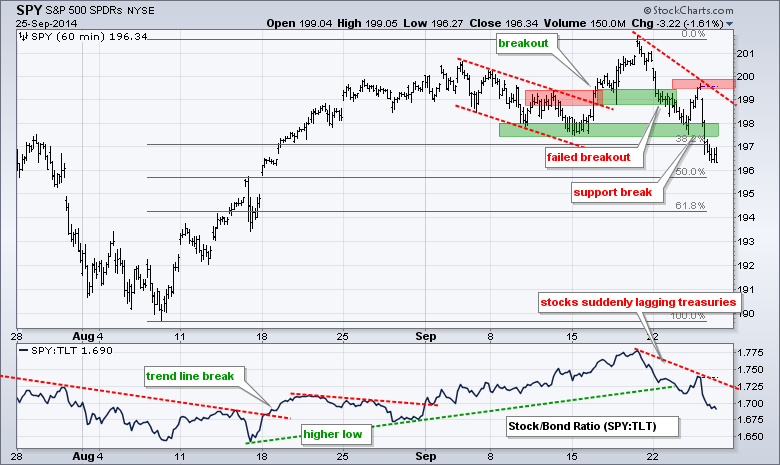
SPY failed to hold the flag breakout and failed to hold support from the mid September low. After a bounce off support Wednesday, SPY gapped down and never looked back on Thursday. The break down clearly reverses the short-term uptrend. I have now added the Fibonacci retracement lines for potential targets (50% and 61.8% retracement lines). The indicator window shows stocks underperforming Treasuries as the SPY:TLT ratio moves lower.
**************************************************************
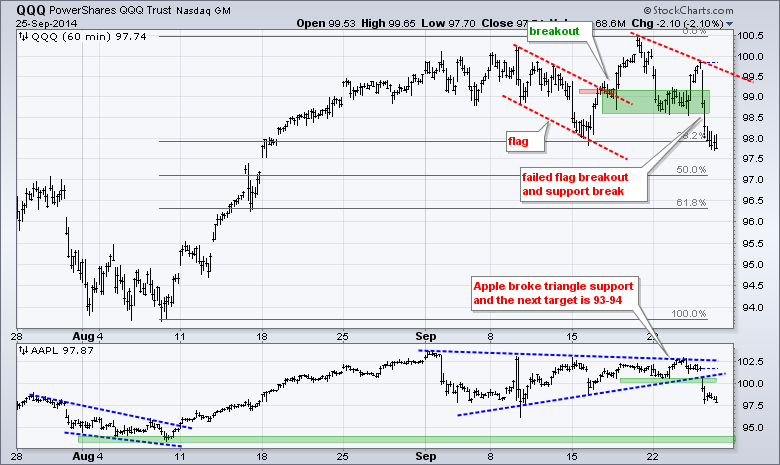
QQQ also failed to hold its flag breakout and broke support with a sharp decline below 98. The ETF now has a lower high and lower low working the past week. The Fibonacci Retracements Tool marks potential targets at the 50% and 62% retracements. The indicator window shows Apple breaking triangle support and holding that break down. The next target is 93-94.
**************************************************************
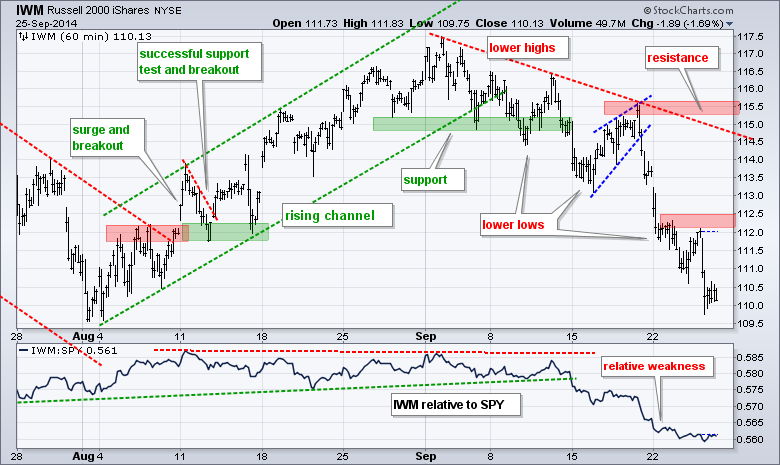
No change. IWM started working its way lower the first two weeks of September and then plunged over the last five trading days. The ETF may have become short-term oversold, but the downtrend and relative weakness still dominate. I will mark a minor resistance zone at 112.5, a break of which could trigger a bigger oversold bounce. I will leave major resistance at 115.6 for now.
**************************************************************
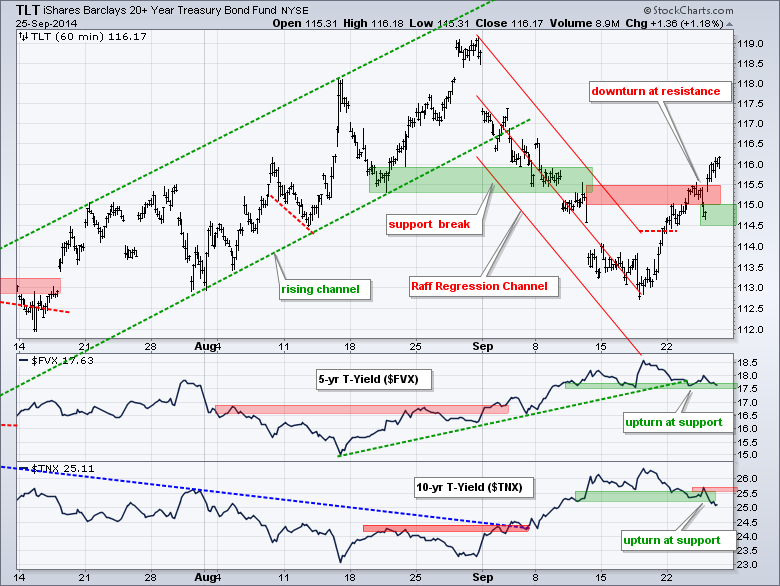
The 20+ YR T-Bond ETF (TLT) broke the Raff Regression Channel last week and exceeded resistance this week. Also notice that the 10-YR Treasury Yield ($TNX) broke the support zone. The 5-year Treasury Yield ($FVX) remains at support and has yet to break down though. Broken resistance and Wednesday's low mark a support zone in the 114.5-115 area.
**************************************************************
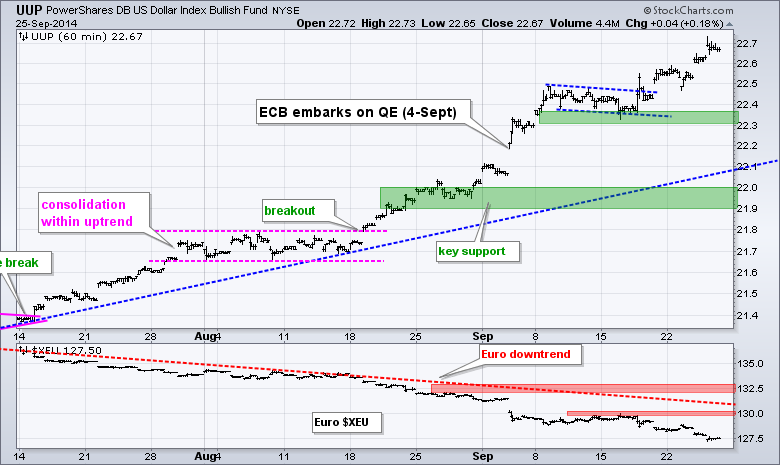
No change. UUP consolidated in mid September and then broke out (twice). The consolidation lows mark first support in the 22.30-22.40 area. While a move below this level would break support, I would not turn bearish because the bigger trend is still up - and the Euro is in a strong downtrend. Key support for UUP remains at 21.9 for now.
**************************************************************
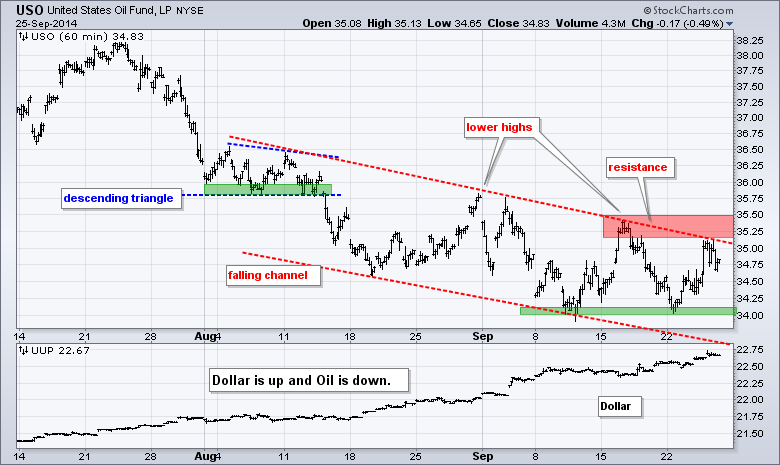
No change. The USO Oil Fund (USO) found support in the 34 area with two bounces this month and surged to the channel trend line. Oil is definitely oversold and ripe for a bounce, but relentless strength in the Dollar could limit a bounce. Key resistance is set at 35.50. A breakout here would reverse the short-term downtrend.
**************************************************************
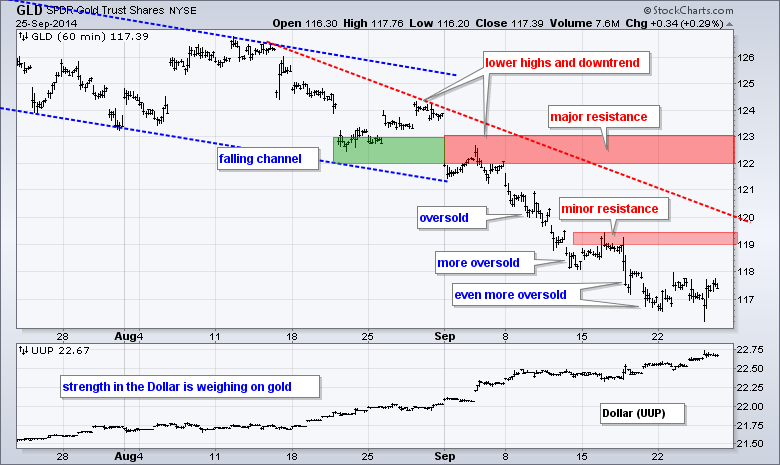
No change. Gold is a classic case of becoming oversold and remaining oversold. With the recent highs around 119-119.5, I will move minor resistance to this area. A breakout here could give way to an oversold bounce. Chartists should also watch the Dollar because gold is clearly tied to the Dollar. Broken support and the early September high mark major resistance in the 122-123 area.
***************************************************************
Key Reports and Events (all times Eastern):
Fri - Sep 26 - 08:30 - GDP
Fri - Sep 26 - 09:55 - Michigan Sentiment
Chart Setups on Tuesday and Thursday.
This commentary and charts-of-interest are designed to stimulate thinking. This analysis is not a recommendation to buy, sell, hold or sell short any security (stock ETF or otherwise). We all need to think for ourselves when it comes to trading our own accounts. First, it is the only way to really learn. Second, we are the only ones responsible for our decisions. Think of these charts as food for further analysis. Before making a trade, it is important to have a plan. Plan the trade and trade the plan. Among other things, this includes setting a trigger level, a target area and a stop-loss level. It is also important to plan for three possible price movements: advance, decline or sideways. Have a plan for all three scenarios BEFORE making the trade. Consider possible holding times. And finally, look at overall market conditions and sector/industry performance.


