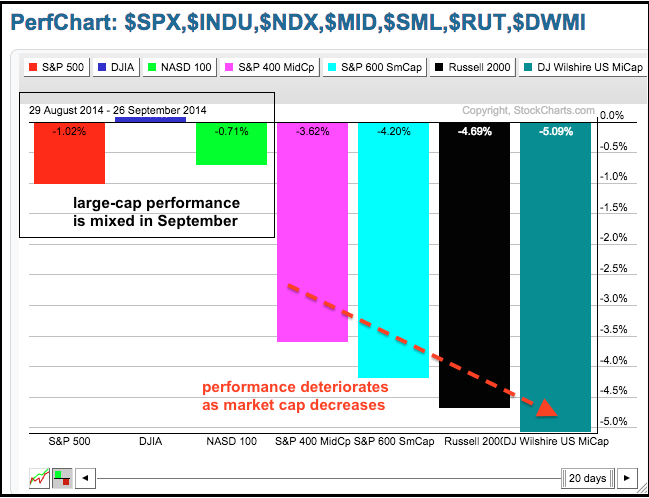
Stocks remain bifurcated with performance deteriorating as we move down the market-cap scale. The S&P 500 is down 1% this month, the Nasdaq 100 is down .71% and the Dow Industrials is up a fraction. A 1% decline hardly qualifies as a correction. Mid-caps and small-caps have corrected in September with the S&P MidCap 400 down 3.62% and the S&P Small-Cap 600 down 4.2%. The DJ Wilshire Microcap Index is leading the pullback with a 5.09% decline. The market has shifted away from the riskier end of the market. Harking back to 2011, we would say the market is in risk off mode. Notice that Treasuries bounced last week, commodities moved lower and the Dollar moved higher. At this stage, I think stocks are in the midst of a correction within a bigger uptrend. While we can guesstimate correction targets, a correction is really as long as a piece of string. Nobody really knows how long or far it will extend. It will end when it ends. In the mean time, I will be watching breadth indicators for signs of strength that may signal an end. Breadth remains bearish right now and there are NO signs of internal strengthening. As always with the first of the month, it is a big week for economic reports. We can ISM Manufacturing, ADP Employment and Auto-Truck sales on Tuesday, Jobless Claims on Wednesday and the Employment Report on Friday. We also get ISM Services on Friday.
**This chart analysis is for educational purposes only, and should not
be construed as a recommendation to buy, sell or sell-short said securities**
**************************************************************
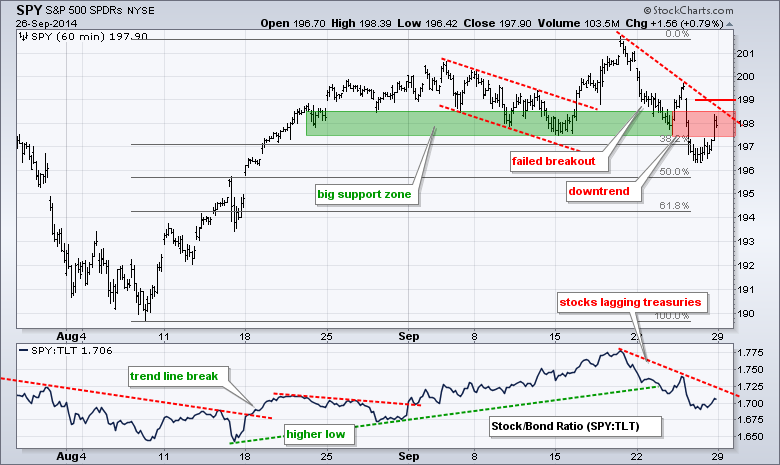
The short-term downtrend is less than two weeks old, but SPY is clearly trending lower with a lower high below 200 and a lower low below 197. There was a big support zone around 198 and this zone now turns into first resistance. Throw in a weak open on Monday and the two week trend line, and I would mark resistance at 199. As long as the downtrend remains, the Fibonacci Retracements Tool marks a target zone around 195 (50-62% retracements).
**************************************************************
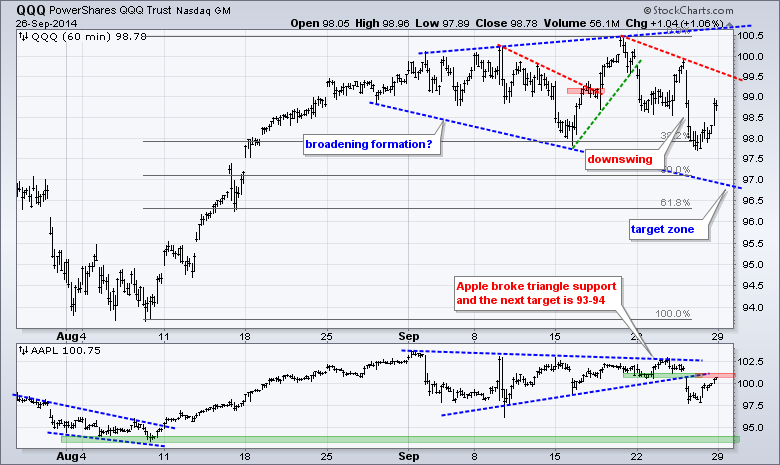
The swings in QQQ are getting wider with a possible broadening formation taking shape. The current swing is down with trend line resistance set at 99.7. The lower trend line of the broadening formation and the 50-62% retracement zone mark a target in the 96.5-97 area. Apple broke down last week and bounced back above 100 on Friday. This could be just an oversold bounce of throwback as broken support turns resistance.
**************************************************************
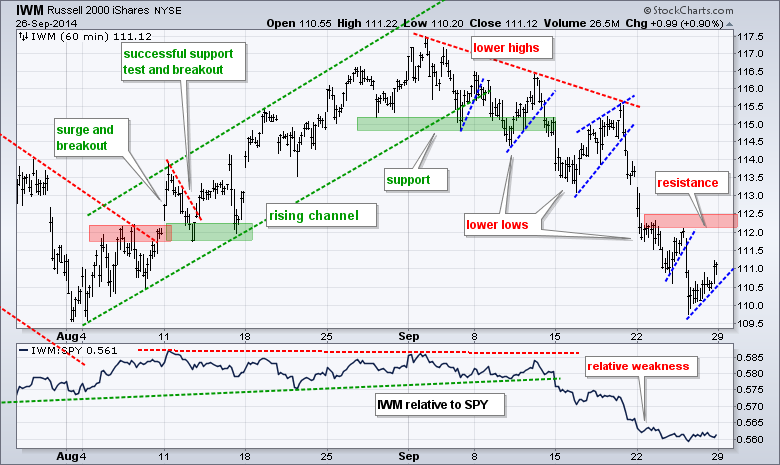
It is just one failure after another on the IWM chart. The ETF peaked at the beginning of September and moved lower with a series of failed rallies (dotted blue trend lines). Each bounce resulted in a lower high and each trend line break led to a lower low. I will mark resistance at last week's highs (112-112.5). The indicator window shows the IWM:SPY ratio breaking down in mid September and remaining weak as small-caps underperform large-caps.
**************************************************************
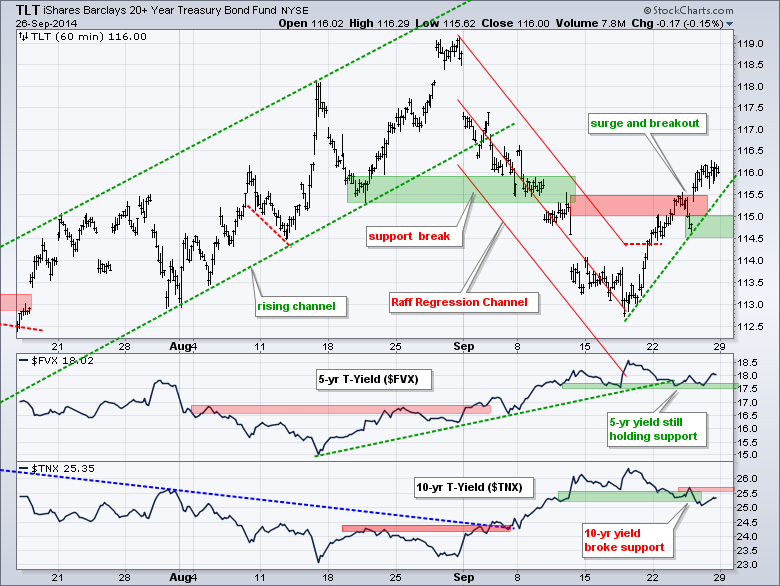
The 20+ YR T-Bond ETF (TLT) surged above resistance to extend its sharp advance. First support is marked in the 114.5-115 area. The 5-year Treasury Yield ($FVX) is still holding support and has yet to break down. The 10-YR Treasury Yield ($TNX), however, did break support and is moving lower. I think the break down in $TNX is bullish for TLT because Treasury yields move inverse prices.
**************************************************************
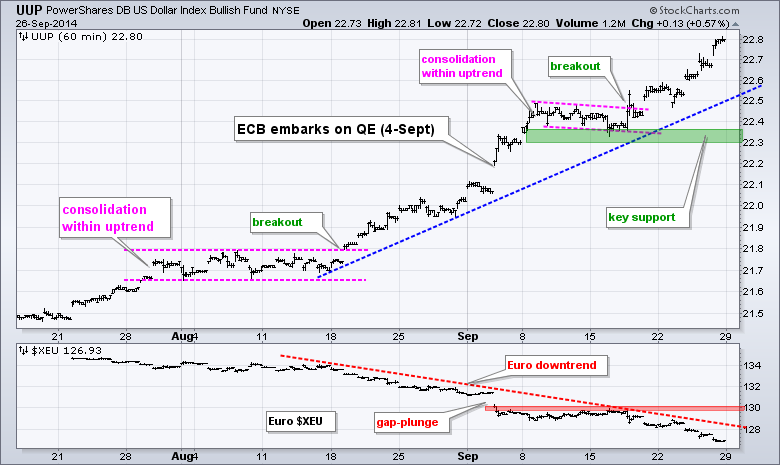
UUP hit new highs for the move last week and remains in a strong uptrend. The mid September lows mark key support in the 22.3-22.4 area. The Euro Index ($XEU) is in a strong downtrend, which accelerated on 4-Sep when the European Central Bank (ECB) embarked on quantitative easing. The mid September highs mark resistance at 130.
**************************************************************
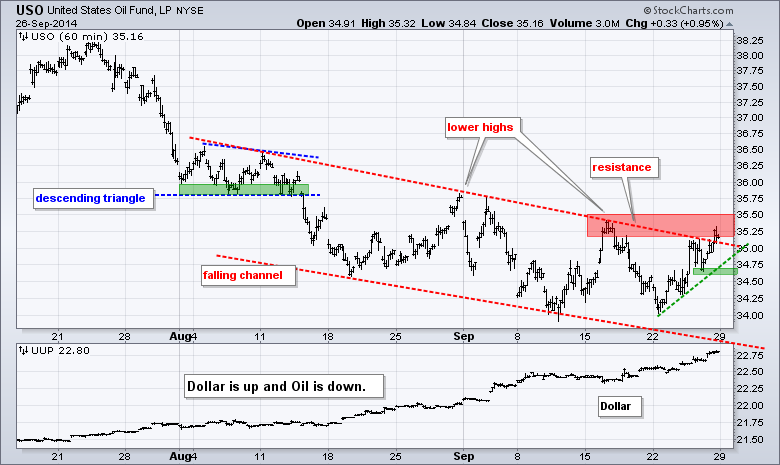
USO remains in a downtrend overall, but the ETF firmed in the 34.35.5 area over the last two weeks. Notice how USO bounced off 34 twice. With the ETF trading in the resistance zone, the moment-of-truth is at hand. A breakout at 35.5 would be bullish and reverse the short-term downtrend. Careful though. A strong Dollar could still weigh on oil. The green trend line marks the one week upswing and a break below 34.6 would reverse this upswing.
**************************************************************
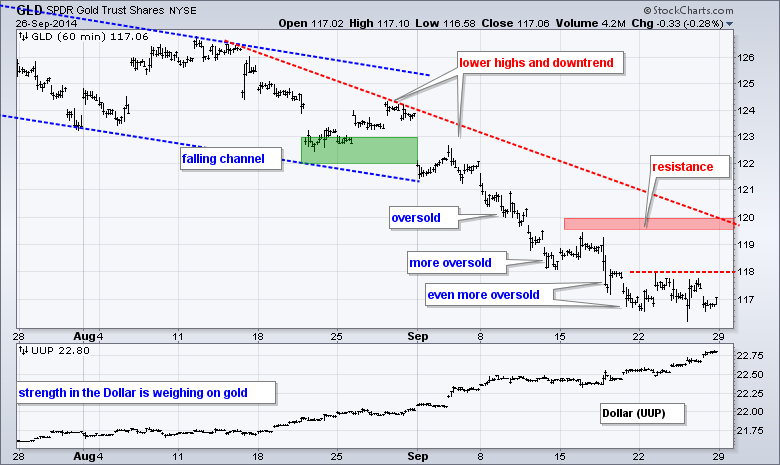
GLD became even more oversold with the move below 117 on 19-Sep and then stalled. Last week's highs mark first resistance at 118 and a break out here would provide the first signal for an oversold bounce. I would not turn short-term bullish because an oversold bounce can be expected at some point. The mid August trend line, mid September high and a buffer mark resistance at 120.
***************************************************************
Key Reports and Events (all times Eastern):
Mon - Sep 29 - 08:30 - Personal Income & Spending
Mon - Sep 29 - 08:30 - PCE Prices
Mon - Sep 29 - 10:00 - Pending Home Sales
Tue - Sep 30 - 09:00 - Case-Shiller Housing Index
Tue - Sep 30 - 09:45 - Chicago PMI
Tue - Sep 30 - 10:00 - Consumer Confidence
Wed - Oct 01 - 07:00 - MBA Mortgage Index
Wed - Oct 01 - 08:15 - ADP Employment
Wed - Oct 01 - 10:00 - ISM Manufacturing Index
Wed - Oct 01 - 10:00 - Construction Spending
Wed - Oct 01 - 10:30 - Crude Inventories
Wed - Oct 01 - 14:00 - Auto Sales/Truck Sales
Thu - Oct 02 - 07:30 - Challenger Job Report
Thu - Oct 02 - 08:30 - Initial Jobless Claims
Thu - Oct 02 - 10:00 - Factory Orders
Thu - Oct 02 - 10:30 - Natural Gas Inventories
Fri - Oct 03 - 08:30 - Employment Report
Fri - Oct 03 - 10:00 - ISM Services Index
Chart Setups on Tuesday and Thursday.
This commentary and charts-of-interest are designed to stimulate thinking. This analysis is not a recommendation to buy, sell, hold or sell short any security (stock ETF or otherwise). We all need to think for ourselves when it comes to trading our own accounts. First, it is the only way to really learn. Second, we are the only ones responsible for our decisions. Think of these charts as food for further analysis. Before making a trade, it is important to have a plan. Plan the trade and trade the plan. Among other things, this includes setting a trigger level, a target area and a stop-loss level. It is also important to plan for three possible price movements: advance, decline or sideways. Have a plan for all three scenarios BEFORE making the trade. Consider possible holding times. And finally, look at overall market conditions and sector/industry performance.


