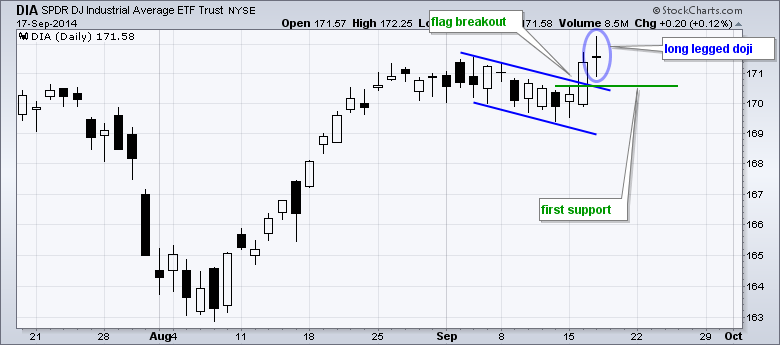
The Fed has come and gone, and the major index ETFs managed to hold on to small gains. Finance, industrials and materials led the sector SPDRs higher, but their gains were modest (.39% to .60%). Energy was weak as oil fell again. Gold miners were hammered again as gold fell another 1%. The Metals & Mining SPDR (XME), however, gained over 1% with help from steel stocks. Within the finance sector, the Broker-Dealer iShares (IAI) led with a 1.31% gain and a 52-week high. The Dow Diamonds (DIA) hit a new high, but finished the day with a long-legged doji. This candlesticks signal indecision and I am not surprised with indecision on a Fed day. Indecision can sometimes foreshadow a reversal and I would watch for a move below 170.50. In fact, a weak open and long black candlestick today would make for an evening doji star over the last three days. For now, the flag breakout is the dominant short-term signal and it remains valid until proven otherwise.
**This chart analysis is for educational purposes only, and should not
be construed as a recommendation to buy, sell or sell-short said securities**
**************************************************************
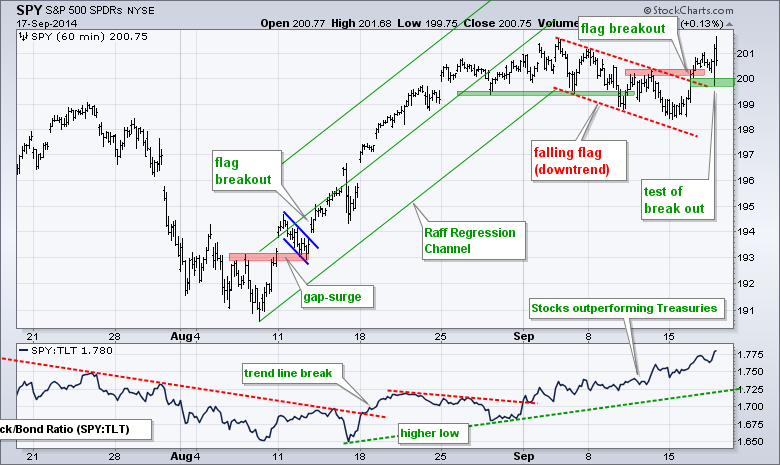
SPY broke flag resistance with a surge above 200 on Tuesday and tested this breakout with a little Fed volatility on Wednesday. The spike low and broken resistance combine to mark first support at 199.6. A break below this level would negate the flag breakout and put SPY back in corrective mode.
**************************************************************
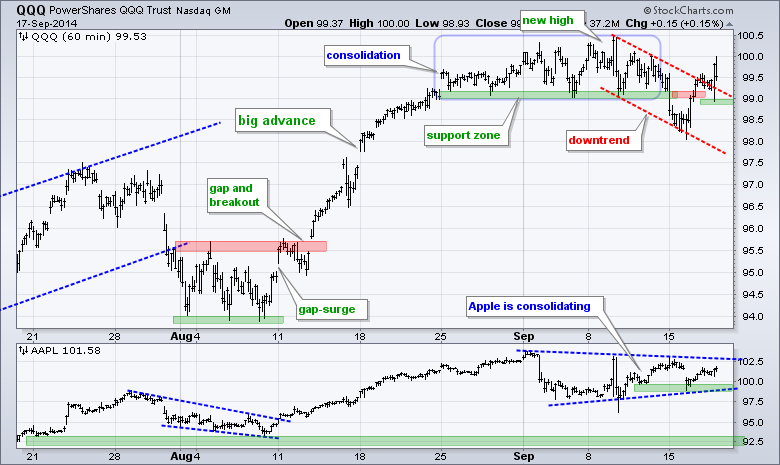
QQQ broke out in the afternoon and the broken resistance zone turns first support. A strong breakout will hold and a weak breakout will fold. Broken resistance and the afternoon low combine to mark first support at 98.8. A move below this level would argue for more correction from QQQ. The indicator window shows AAPL consolidating with support at 98.
**************************************************************
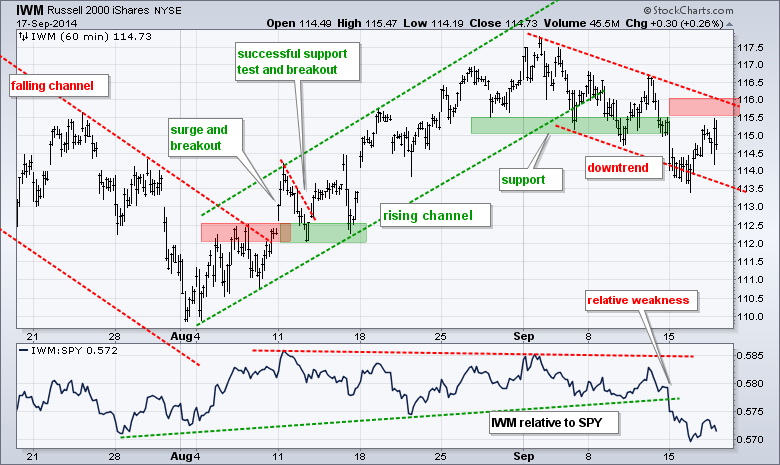
IWM got a bounce over the last two days, but remains within a downtrend since early September. The trend line, broken support and a buffer combine to mark key resistance in the 115.5-116 area. A post-Fed breakout here would reverse the downtrend and be bullish for small-caps, and the market overall. The indicator window shows the price relative breaking down as IWM underperforms SPY.
**************************************************************
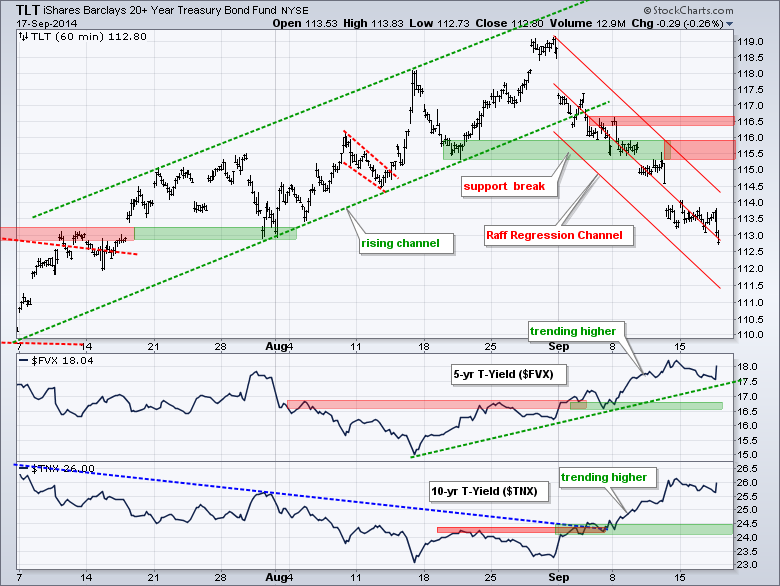
No change. TLT broke support with a sharp decline this month. Even though the ETF is short-term oversold after a 5+ percent decline, the short-term trend is down and I am marking key resistance in the 116.5 area. Further down, we could see an oversold bounce back to broken support in the 115.5 area. The indicator windows show the 5-year Treasury Yield ($FVX) moving above its July high and the 10-YR Treasury Yield ($TNX) moving above 2.6%.
**************************************************************
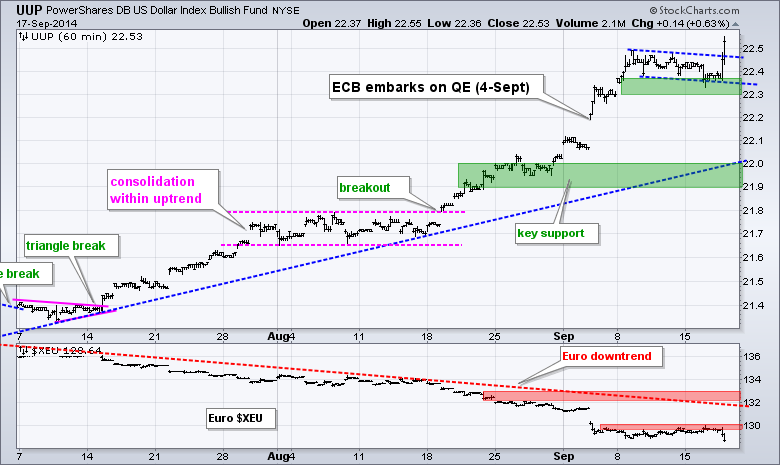
The Euro Index ($XEU) remains in a relentless downtrend and the US Dollar ETF (UUP) is in a strong uptrend. UUP consolidated for a week and broke out with a move above 22.5. I will mark first support at 22.3 for now. Key support remains at 21.9, but I will be raising this level in the coming days or weeks. First resistance for the Euro is set at 130 and key resistance remains at 133.
**************************************************************
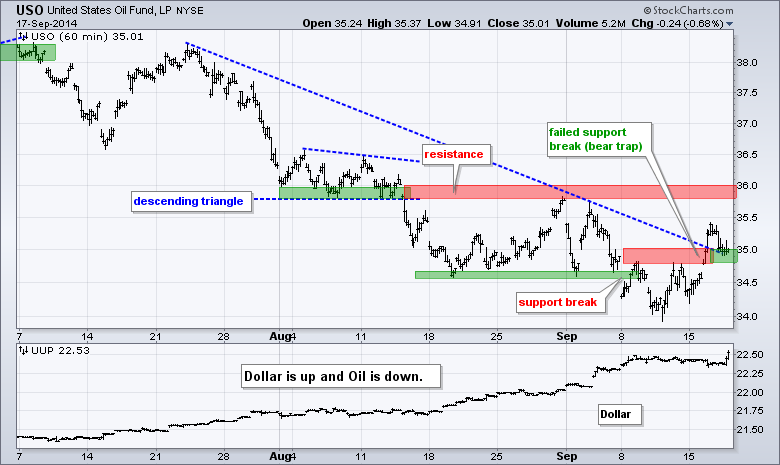
No change. The USO Oil Fund (USO) broke support last week and moved back above the support break this week. This failed support break is called a bear trap. The red zone (34.8-35) marks the first support level to watch because a valid reversal will hold. A quick move back below 34.8 would negate this move. I am going to leave key resistance at 36 because I am not convinced that the two month downtrend has fully reversed.
**************************************************************
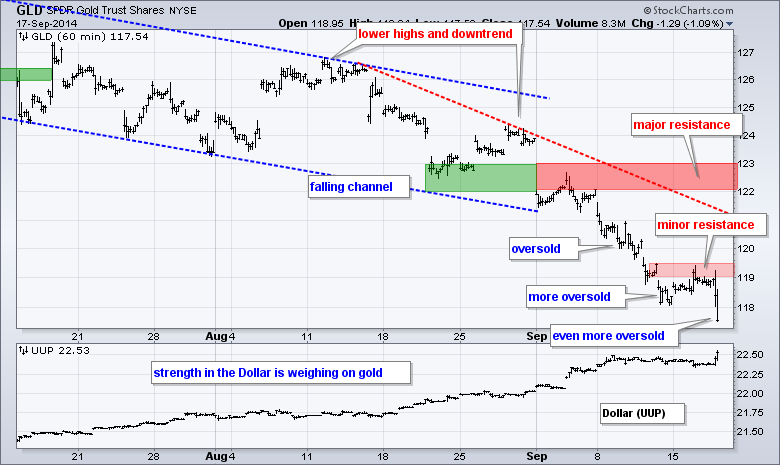
Gold is a classic case of becoming oversold and remaining oversold. With the recent highs around 119-119.5, I will move minor resistance to this area. A breakout here could give way to an oversold bounce. Chartists should also watch the Dollar because gold is clearly tied to the Dollar. Broken support and the early September high mark major resistance in the 122-123 area.
***************************************************************
Key Reports and Events (all times Eastern):
Thu - Sep 18 - 08:30 - Initial Jobless Claims
Thu - Sep 18 - 08:30 - Housing Starts/Building Permits
Thu - Sep 18 - 10:00 - Philadelphia Fed
Thu - Sep 18 - 10:30 - Natural Gas Inventories
Thu - Sep 18 - 09:00 - Scottish Referendum
Fri - Sep 19 - 10:00 - Leading Economic Indicators
Chart Setups on Tuesday and Thursday.
This commentary and charts-of-interest are designed to stimulate thinking. This analysis is not a recommendation to buy, sell, hold or sell short any security (stock ETF or otherwise). We all need to think for ourselves when it comes to trading our own accounts. First, it is the only way to really learn. Second, we are the only ones responsible for our decisions. Think of these charts as food for further analysis. Before making a trade, it is important to have a plan. Plan the trade and trade the plan. Among other things, this includes setting a trigger level, a target area and a stop-loss level. It is also important to plan for three possible price movements: advance, decline or sideways. Have a plan for all three scenarios BEFORE making the trade. Consider possible holding times. And finally, look at overall market conditions and sector/industry performance.


