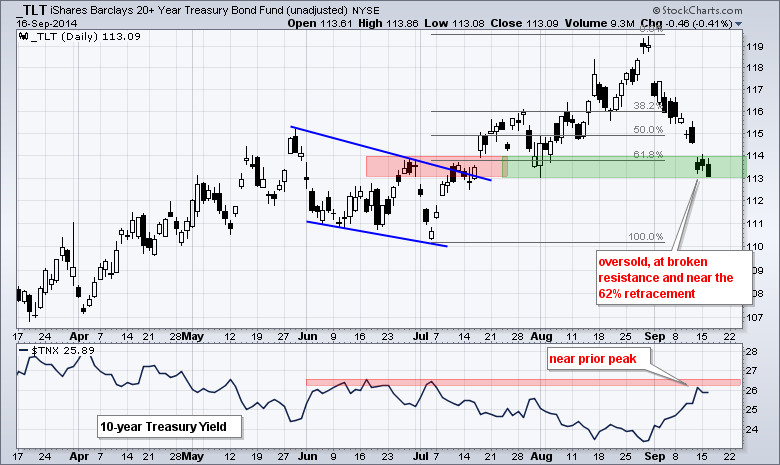
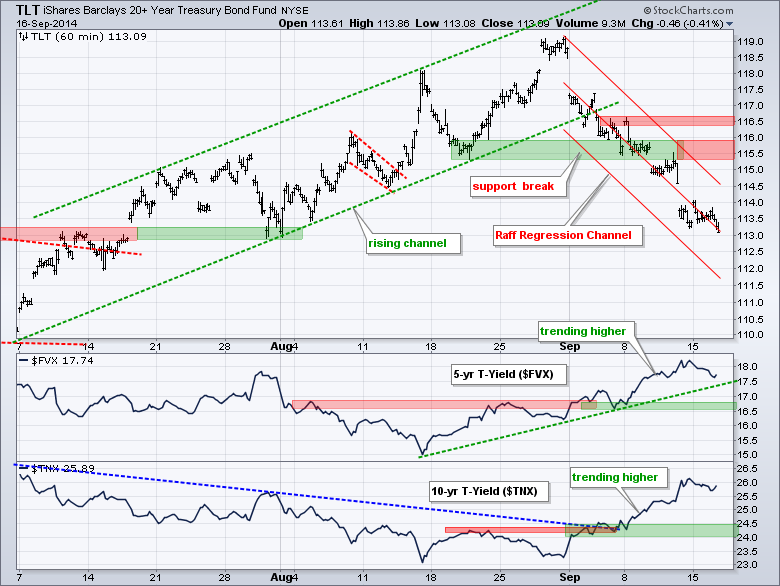
Fed day is here and the markets will hang on every word from the Fed. Sometimes the markets even hang are words that don't appear in the Fed statement. Truth be told, I do not know what the Fed will say or do, and I do not know how the market will react. If playing the Fed game, a trader needs to get two things right. You have to guess the Fed's move and the market's reaction to that move. The bond market has voted for more hawkishness from the Fed because the 10-YR Treasury Yield ($TNX) surged over the last few weeks. The S&P 500 has held up as the 20+ YR T-Bond ETF (TLT) declined and this means stocks are outperforming Treasuries, which is net positive for stocks. The chart below shows TLT falling around 5% the last few weeks and becoming short-term oversold. Chartists do not need a momentum oscillator to figure out that TLT is oversold. Also notice that TLT is near broken support and the 62% retracement. The indicator window shows the 10-YR Treasury Yield ($TNX) near the summer peaks. TLT could bounce if the Fed does not deliver what the bond market has priced in over the last three weeks.
**This chart analysis is for educational purposes only, and should not
be construed as a recommendation to buy, sell or sell-short said securities**
**************************************************************
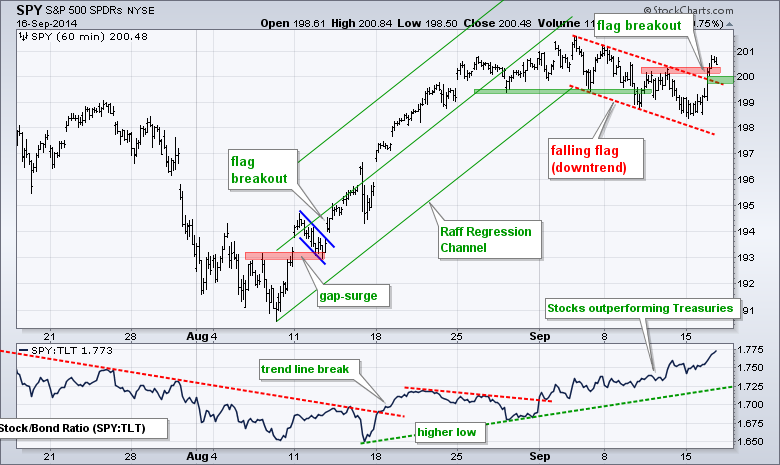
SPY got its flag breakout with a surge above 200.50 on the day before the Fed policy statement. I think that a strong breakout should hold and I am inclined to mark support fairly tight. A move back below 199.6 would signal a failed breakout. The challenge will be Fed volatility just before and after the announcement.
**************************************************************
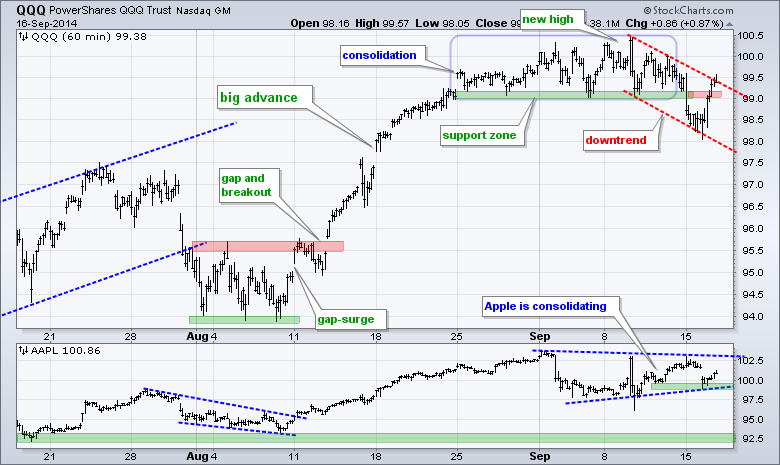
QQQ moved back above its support break and ended the day right at the flag trend line. A follow thru breakout at 99.7 would be bullish here. I am watching Apple for clues as the stock consolidates with a triangle taking shape. A breakout at 103 would be bullish, while a break below 98 would be short-term bearish.
**************************************************************
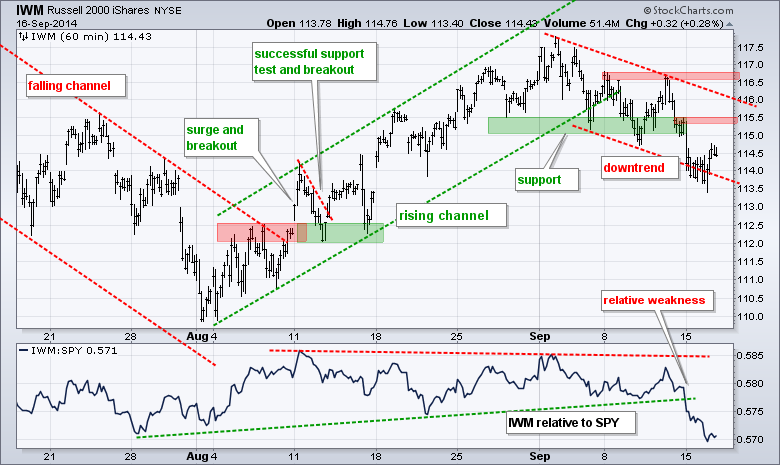
IWM firmed near the lower trend line of the falling flag and got a feeble bounce in the afternoon. And I do mean feeble. The ETF remains in a clear downtrend and shows relative weakness. The broken support zone turns first resistance at 115.50. A move above this level would provide the first sign that IWM will break flag resistance, which is set at 116.80.
**************************************************************
No change. TLT broke support with a sharp decline this month. Even though the ETF is short-term oversold after a 4+ percent decline, the short-term trend is down and I am marking key resistance in the 116.5 area. Further down, we could see an oversold bounce back to broken support in the 115.5 area. The indicator windows show the 5-year Treasury Yield ($FVX) moving above its July high and the 10-YR Treasury Yield ($TNX) moving above 2.6%.
**************************************************************
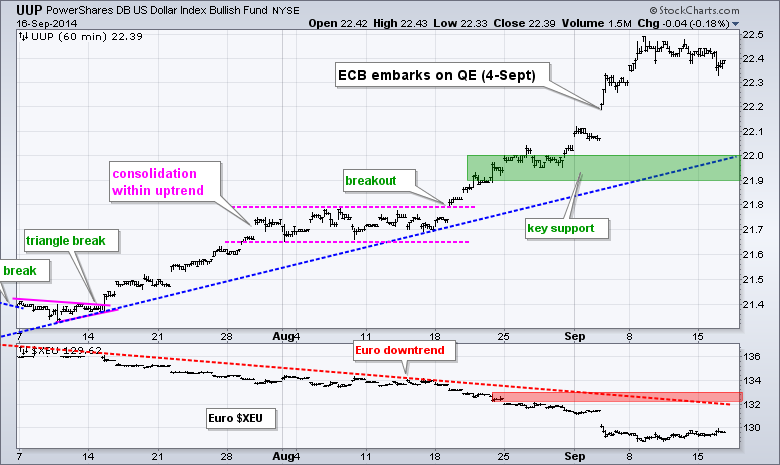
No change. Mark that date. On September 5th, 2014, the European Central Bank (ECB) embarked on quantitative easing. We have seen what happened to the Dollar during QE and it is not the Euro's turn (and the Yen). The US is winding down QE, while the other two are ramping up. The Euro Index ($XEU) plunged over 1% and hit a fresh 52-week low. Key support is set at 21.90.
**************************************************************
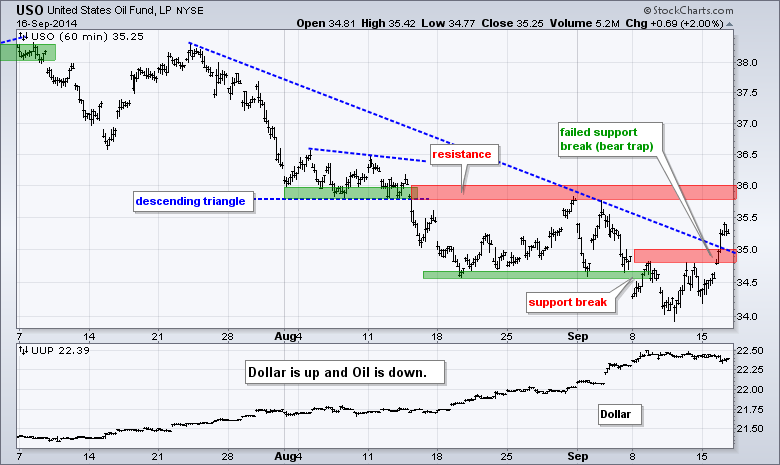
The USO Oil Fund (USO) broke support last week and moved back above the support break this week. This failed support break is called a bear trap. The red zone (34.8-35) marks the first support level to watch because a valid reversal will hold. A quick move back below 34.8 would negate this move. I am going to leave key resistance at 36 because I am not convinced that the two month downtrend has fully reversed.
**************************************************************
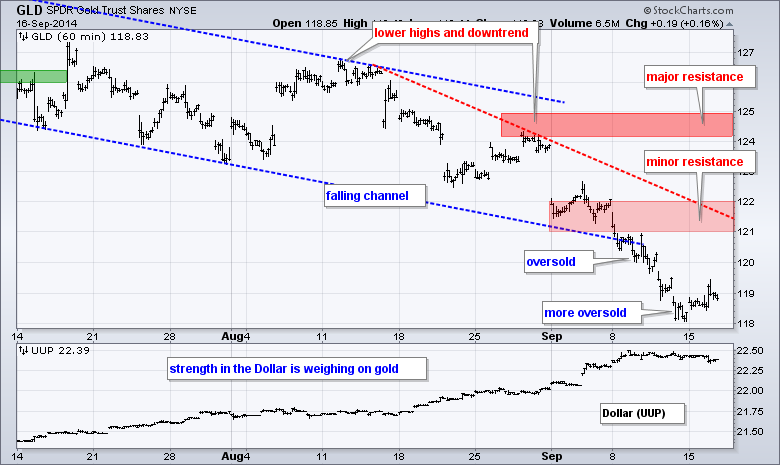
No change. The Gold SPDR (GLD) started the week oversold and near the lower trend line of the falling channel. GLD ended the week even more oversold and well below the channel trend line. This is a classic case of becoming oversold and remaining oversold. If having to pick first resistance, I would user the early September lows and the mid August trend line to mark it in the 121-122 area. I will mark key resistance at 125.
***************************************************************
Key Reports and Events (all times Eastern):
Wed - Sep 17 - 07:00 - MBA Mortgage Index
Wed - Sep 17 - 08:30 - Consumer Price Index (CPI)
Wed - Sep 17 - 08:30 - Current Account Balance
Wed - Sep 17 - 10:00 - NAHB Housing Market Index
Wed - Sep 17 - 10:30 - Crude Oil Inventories
Wed - Sep 17 - 14:00 - FOMC Policy Statement
Thu - Sep 18 - 08:30 - Initial Jobless Claims
Thu - Sep 18 - 08:30 - Housing Starts/Building Permits
Thu - Sep 18 - 10:00 - Philadelphia Fed
Thu - Sep 18 - 10:30 - Natural Gas Inventories
Thu - Sep 18 - 09:00 - Scottish Referendum
Fri - Sep 19 - 10:00 - Leading Economic Indicators
Chart Setups on Tuesday and Thursday.
This commentary and charts-of-interest are designed to stimulate thinking. This analysis is not a recommendation to buy, sell, hold or sell short any security (stock ETF or otherwise). We all need to think for ourselves when it comes to trading our own accounts. First, it is the only way to really learn. Second, we are the only ones responsible for our decisions. Think of these charts as food for further analysis. Before making a trade, it is important to have a plan. Plan the trade and trade the plan. Among other things, this includes setting a trigger level, a target area and a stop-loss level. It is also important to plan for three possible price movements: advance, decline or sideways. Have a plan for all three scenarios BEFORE making the trade. Consider possible holding times. And finally, look at overall market conditions and sector/industry performance.


