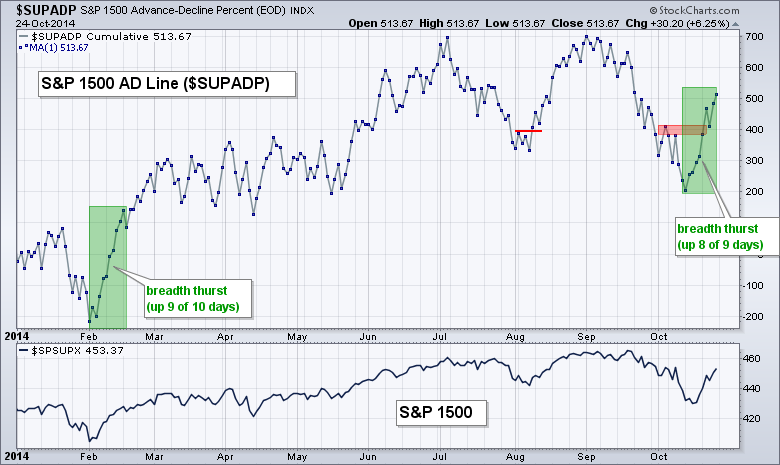
It was another strong week for stocks as the market put in another broad-based rally. Month-to-date, SPY and QQQ are still slightly lower, but IWM is up around 1.5% for October. This suggests that small-caps are showing some upside leadership as we head into November-December. Chart XX shows the AD Line for the S&P 1500 ($SUPADP) surging over the last nine days. In fact, AD Percent was positive for eight of the last nine days. This surge in positive breadth looks like a breadth thrust that could kick off an extended advance in stocks. At the very least, we have seen strong buying pressure that is unlikely to dissipate over night. Even if this breadth thrust ultimately fails, I would expect some sort of topping formation to take shape and a reversal signal to warn of a new downswing. The trend is current up and we should trade accordingly until the evidence suggest otherwise.
**This chart analysis is for educational purposes only, and should not
be construed as a recommendation to buy, sell or sell-short said securities**
**************************************************************
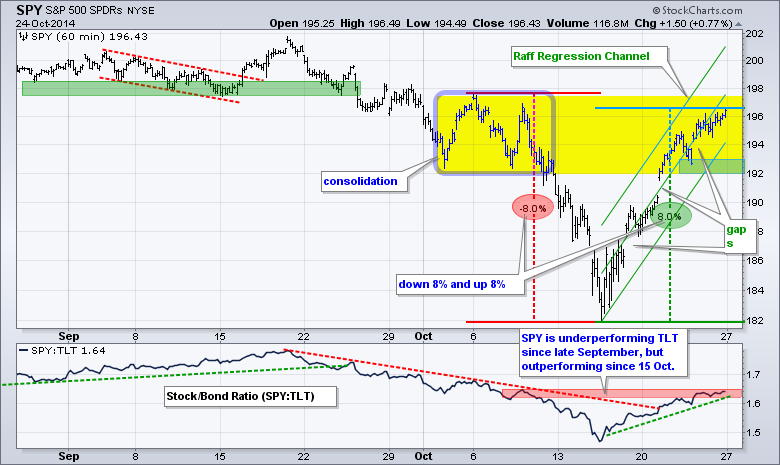
SPY fell 8% and then surged 8%. The surge includes three gaps and a breadth thrust. Which is the dominant move here? I am betting on the 8% surge because it is the most recent move and it negated the 8% decline with a breadth thrust. Even though SPY may be in a resistance zone from the early October trading range, the short-term trend is clearly up. Resistance is just potential at this stage. The Raff Regression Channel, mid week low and a buffer mark support in the 192-193 area.
**************************************************************
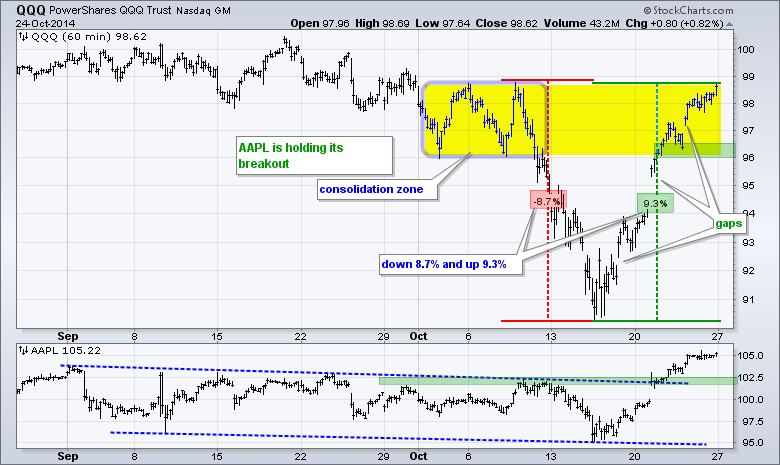
QQQ is up 9.3% and trading near the early October highs. The ETF has completely recovered after the early October plunge. There are three gaps during this surge and each one held. The last gap and mid week low combine to mark first support in the 96-97 area. Even though the ETF is short-term overbought and at a potential resistance level, the short-term trend is clearly up and strong.
**************************************************************
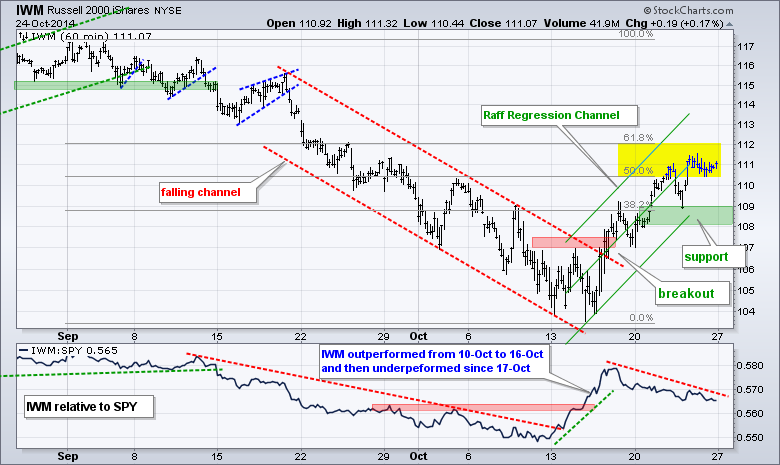
No change. IWM remains in an uptrend since the channel breakout on 16-Oct, but the ETF is up over 7% and trading in the 50-62% retracement zone. This could give way to choppy trading or a pullback. Even so, the short-term trend is clearly up and I will respect this uptrend until proven otherwise. The Raff Regression Channel, mid week low and a buffer mark key support in the 108-109 area. Small-caps have been lagging since 17-Oct and this is negative for IWM.
**************************************************************
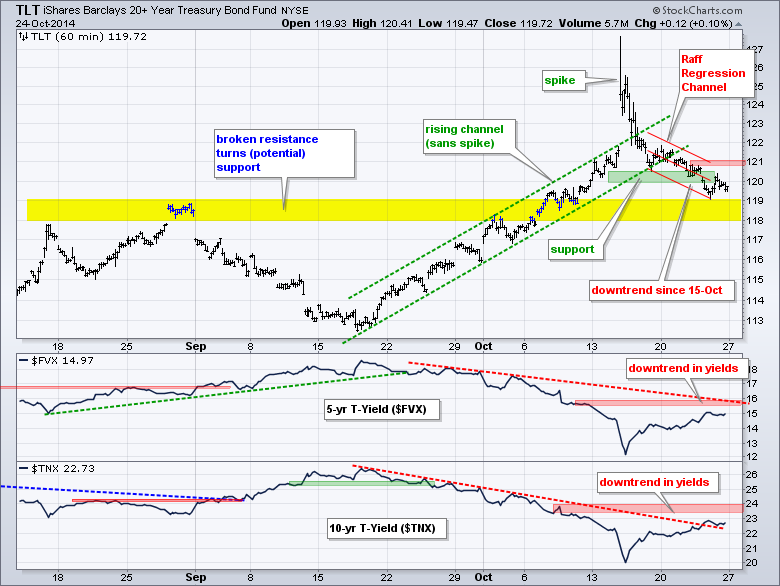
The next two weeks will be big for Treasuries because the FOMC makes it's policy statement on Wednesday, there are a slew of economic reports in early November and the employment report is on Friday, November 7th. On the price chart, I am going to ignore the mid October spike above 127 for now. TLT broke below the lower trend line of the rising channel and moved into a downtrend last week. The red Raff Regression Channel defines this downtrend with resistance at 121. I am watching the 5-year Treasury Yield ($FVX) and 10-YR Treasury Yield ($TNX) closely as well. Resistance breaks in both would be negative for Treasury bond prices.
**************************************************************
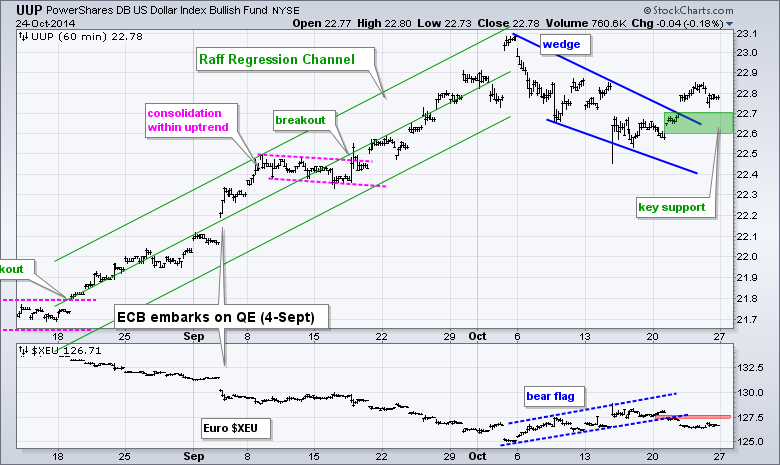
The US Dollar ETF (UUP) broke wedge resistance with a surge above 22.7 and then stalled. Meanwhile, the Euro Index ($XEU) broke flag support to signal a continuation lower. The stress test for the EU banks is out and the Euro is holding firm on Monday morning. UUP broke wedge resistance with a surge and I am using this breakout zone to mark support in the 22.6-22.7 area. It is important that this breakout holds. A move below 22.6 would signal a failure. XEU resistance is set at 127.60.
**************************************************************
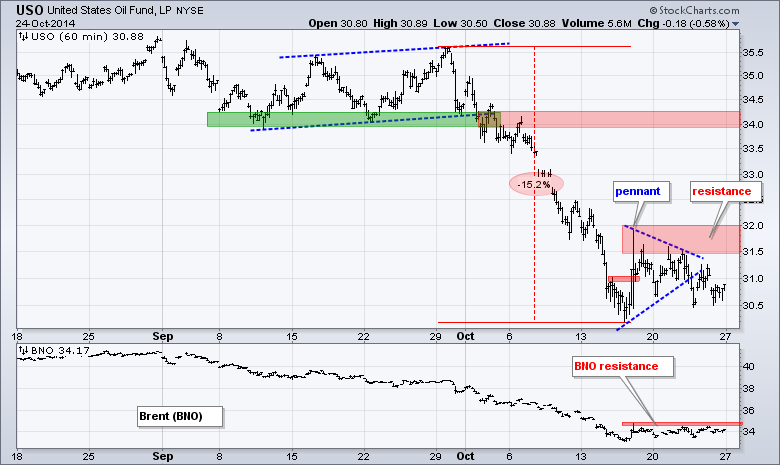
The USO Oil Fund (USO) broke pennant support to signal a continuation of the prior decline. The break is holding for now, but the ETF is showing some signs of firmness in the 30.5-31 area. At this point, the pennant break is bearish until proven otherwise. A move above 31.5 would negate the pennant break and a move above 32 would break short-term resistance. A break above 32 would be bullish and target a bounce to the mid 30s. The indicator window shows the US Brent Oil ETF (BNO) with resistance at 35.
**************************************************************
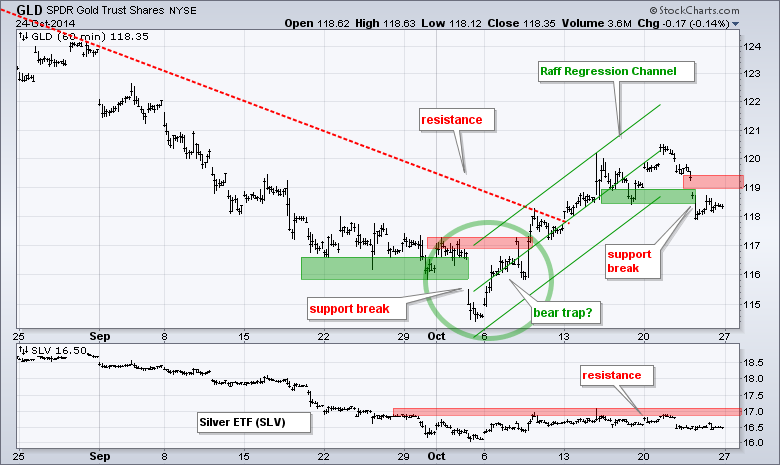
The Gold SPDR (GLD) broke down last week and this break down is holding for now. The bigger trend is down and the October advance was a correction within this downtrend. The break down signals a continuation of the bigger downtrend. I will mark resistance in the 119-119.50 area. A move above 119.5 would negate the breakout and be bullish for gold. I will also be watching the Euro Index ($XEU) for a break above 127.60 because this would be Dollar bearish and gold bullish.
***************************************************************
Key Reports and Events (all times Eastern):
Mon - Oct 27 - 10:00 - Pending Home Sales
Tue - Oct 28 - 08:30 - Durable Goods Orders
Tue - Oct 28 - 09:00 - Case-Shiller Housing Index
Tue - Oct 28 - 10:00 - Consumer Confidence
Wed - Oct 29 - 07:00 - MBA Mortgage Index
Wed - Oct 29 - 10:30 - Crude Oil Inventories
Wed - Oct 29 - 14:00 - FOMC Policy Statement
Thu - Oct 30 - 08:30 - Initial Jobless Claims
Thu - Oct 30 - 08:30 - GDP
Thu - Oct 30 - 10:30 - Natural Gas Inventories
Fri - Oct 31 - 08:30 - Personal Income & Spending
Fri - Oct 31 - 08:30 - PCE Prices
Fri - Oct 31 - 09:45 - Chicago PMI
Fri - Oct 31 - 09:55 - Michigan Sentiment
Charts of Interest are on Tuesdays and Thursdays.
This commentary and charts-of-interest are designed to stimulate thinking. This analysis is not a recommendation to buy, sell, hold or sell short any security (stock ETF or otherwise). We all need to think for ourselves when it comes to trading our own accounts. First, it is the only way to really learn. Second, we are the only ones responsible for our decisions. Think of these charts as food for further analysis. Before making a trade, it is important to have a plan. Plan the trade and trade the plan. Among other things, this includes setting a trigger level, a target area and a stop-loss level. It is also important to plan for three possible price movements: advance, decline or sideways. Have a plan for all three scenarios BEFORE making the trade. Consider possible holding times. And finally, look at overall market conditions and sector/industry performance.


