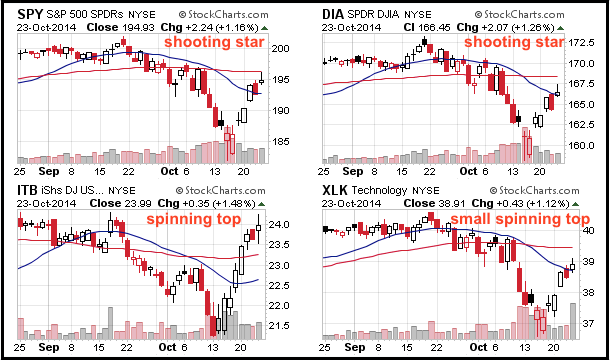
Stocks put in another bullish performance on Thursday with small-caps leading the way. The Russell 2000 Growth iShares (IWO) led the style ETFs with a 2.11% gain. Seven of the nine sectors were up with industrials leading. Several small-cap sectors made big moves with energy, materials and technology surging over 2%. Despite big gains, there was some selling pressure in the afternoon and shooting star candlesticks formed in a few ETFs. There were also some spinning tops, which denote indecision. SPY and DIA formed shooting stars, while ITB and XLK formed spinning tops. Even though the major index ETFs are overbought and in potential resistance zones, I would not view one candlestick as bearish because these patterns require follow through for confirmation. The surge since October 15th has been exceptionally strong and buying pressure is unlikely to dissipate overnight.
**This chart analysis is for educational purposes only, and should not
be construed as a recommendation to buy, sell or sell-short said securities**
**************************************************************
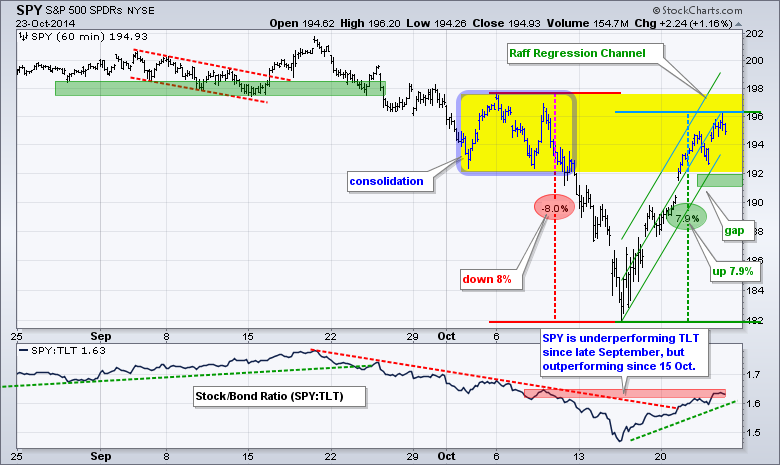
SPY extended its run with an intraday move above 196. Overall, the ETF is short-term overbought after a 7.9% advance and trading back in the early October consolidation, which may mark some resistance. More importantly, the ETF recovered almost all of the early October plunge and remains in an uptrend. The reward-to-risk ratio and a buffer mark support in the 191-193 area. A break below 191 would reverse this uptrend.
**************************************************************
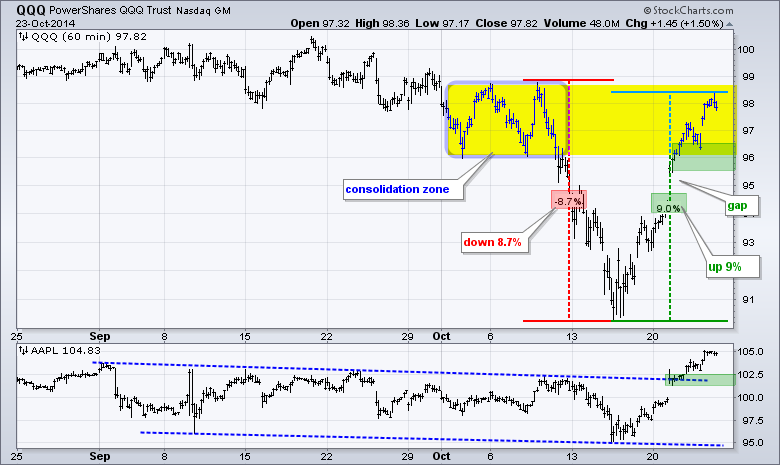
QQQ fell 8.7% and then surged 9% to move from oversold to overbought. Also notice that QQQ is trading in the consolidation zone from early October. This could foreshadow a period of choppy trading or a pullback. The mid week low and a buffer mark key support in the 95.5-96.5 area. The indicator window shows Apple breaking the channel trend line and holding this breakout.
**************************************************************
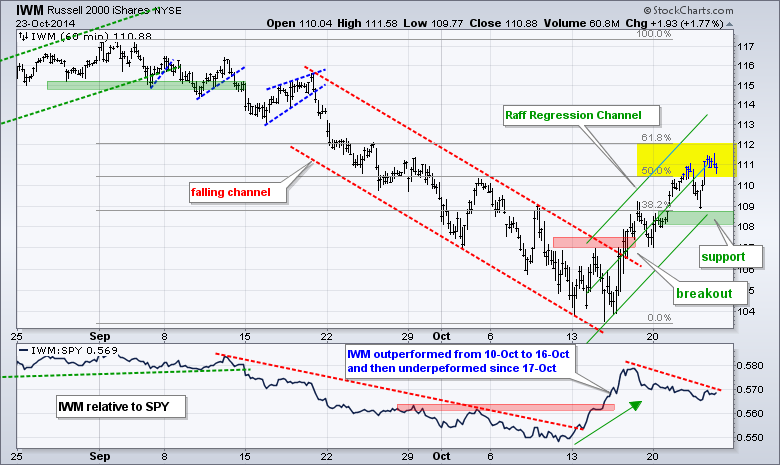
IWM remains in an uptrend since the channel breakout on 16-Oct, but the ETF is up over 7% and trading in the 50-62% retracement zone. This could give way to choppy trading or a pullback. Even so, the short-term trend is clearly up and I will respect this uptrend until proven otherwise. The Raff Regression Channel, mid week low and a buffer mark key support in the 108-109 area. Small-caps have been lagging since 17-Oct and this is negative for IWM.
**************************************************************
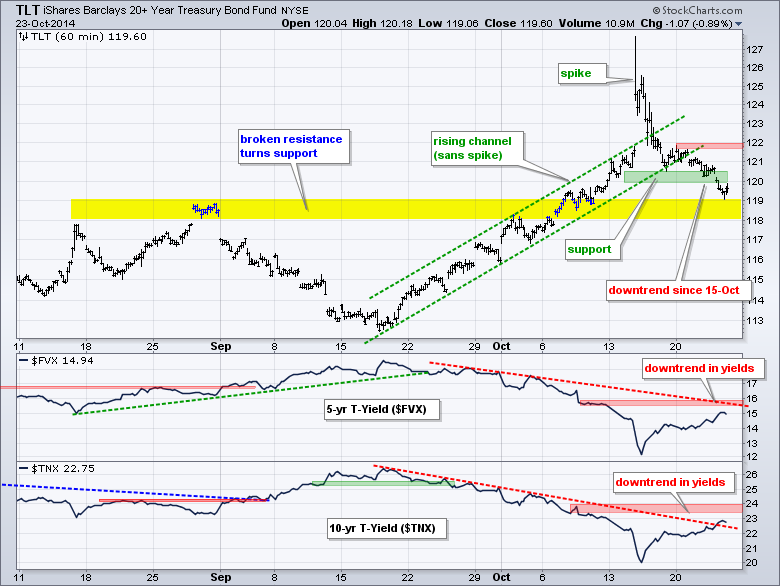
Treasuries are a difficult call right now and the Fed meeting is next week. The 20+ YR T-Bond ETF (TLT) broke support with a move below 120 and Treasury yields have risen since 15-Oct. TLT is in an immediate downtrend, but may find support from broken resistance in the 118-119 area. At this point, my main focus is on the resistance levels for the 5-year Treasury Yield ($FVX) and 10-YR Treasury Yield ($TNX). Upside breakouts in yields would be bearish for Treasury bonds.
**************************************************************
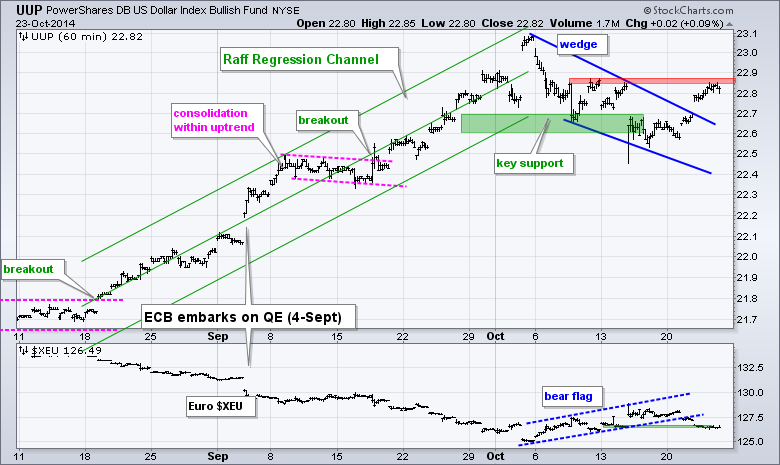
No change. The US Dollar ETF (UUP) is breaking out and the Euro Index ($XEU) is breaking down. These breakouts provide the first sign that the bigger trends are resuming. UUP broke the wedge trend line and the mid October highs mark the next challenge. XEU broke the flag trend line and is testing the mid October low. Note that the European Central Bank (ECB) will release the results of its stress test for EU banks on Sunday. It is mostly theater, but could affect the Euro on Friday-Monday.
**************************************************************
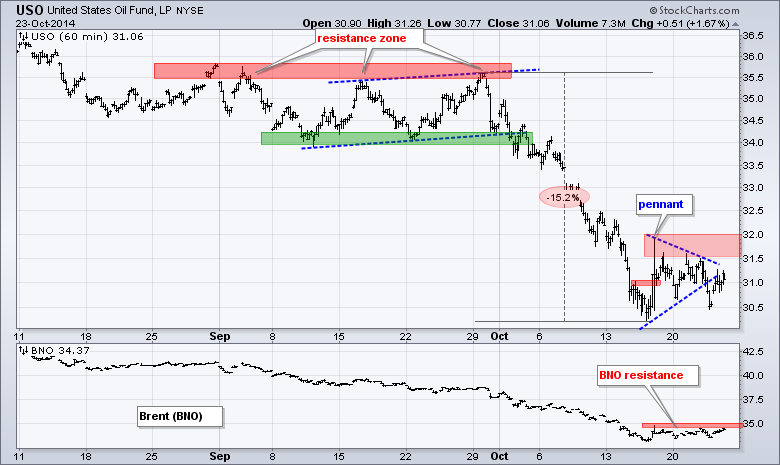
No change. The USO Oil Fund (USO) got a little break above 31 last week, stalled for a few days and move lower on Wednesday. Overall, it looks like a pennant within a downtrend. Pennants are continuation patterns and this break signals a continuation lower. Chartists can mark resistance in the 31.5-32 area. The indicator window shows the US Brent Oil ETF (BNO) with resistance at 35.
**************************************************************
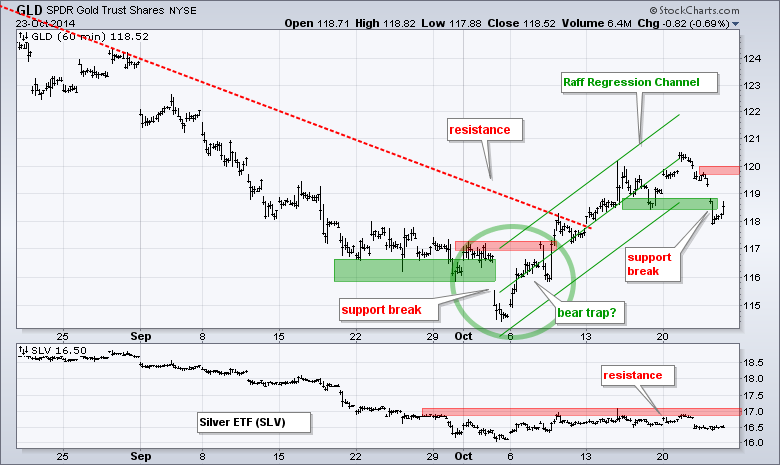
The Gold SPDR (GLD) moved below 118 and broke support over the last two days. Note that I moved support up 50 cents to 118.5 on the chart. Yes, I admit that I just made use of the old hindsight indicator. A Dollar breakout and gold break down makes sense and I am still watching the Dollar for clues on gold. I will mark resistance at 120 for GLD.
***************************************************************
Key Reports and Events (all times Eastern):
Fri - Oct 24 - 10:00 - New Home Sales
Charts of Interest are on Tuesdays and Thursdays.
This commentary and charts-of-interest are designed to stimulate thinking. This analysis is not a recommendation to buy, sell, hold or sell short any security (stock ETF or otherwise). We all need to think for ourselves when it comes to trading our own accounts. First, it is the only way to really learn. Second, we are the only ones responsible for our decisions. Think of these charts as food for further analysis. Before making a trade, it is important to have a plan. Plan the trade and trade the plan. Among other things, this includes setting a trigger level, a target area and a stop-loss level. It is also important to plan for three possible price movements: advance, decline or sideways. Have a plan for all three scenarios BEFORE making the trade. Consider possible holding times. And finally, look at overall market conditions and sector/industry performance.


