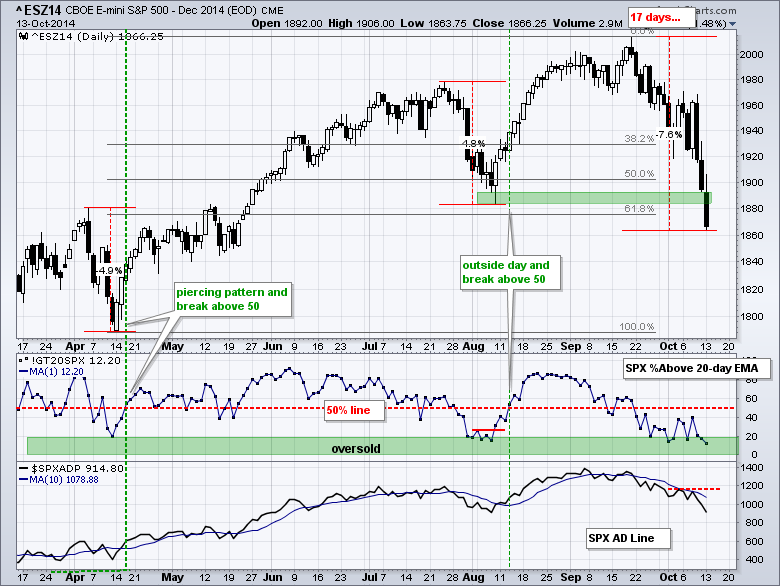
Stocks took it on the chin again as broad selling pressure hit most areas. Most of the major index ETFs declined around 1.5% on the day. The Russell 2000 iShares held up relatively well with a .40% decline and the Russell MicroCap iShares finished with a small gain. The Utilities SPDR held up the best (smallest decline) and the Finance SPDR also showed some relative strength on Monday. Note that the SmallCap Financials ETF (PSCF) and the SmallCap Utilities ETF (PSCU) actually gained on the day. Gold and silver extended their oversold bounces, and this put like into the Gold Miners ETF (GDX). Energy stocks were absolutely slammed as the FirstTrust Natural Gas ETF (FCG) fell over 6%, the Oil & Gas Equip & Services SPDR (XES) declined over 3% and the Oil & Gas E&P SPDR (XOP) fell over 5%. These groups are probably the most oversold in the market right now. The chart below shows the December e-mini falling 7.6% in 17 days and breaking below the early August low. At this point, the contract as exceeded its 62% retracement and broken support. A quick move back above 1890 is needed to remedy this bearish development.
**This chart analysis is for educational purposes only, and should not
be construed as a recommendation to buy, sell or sell-short said securities**
**************************************************************
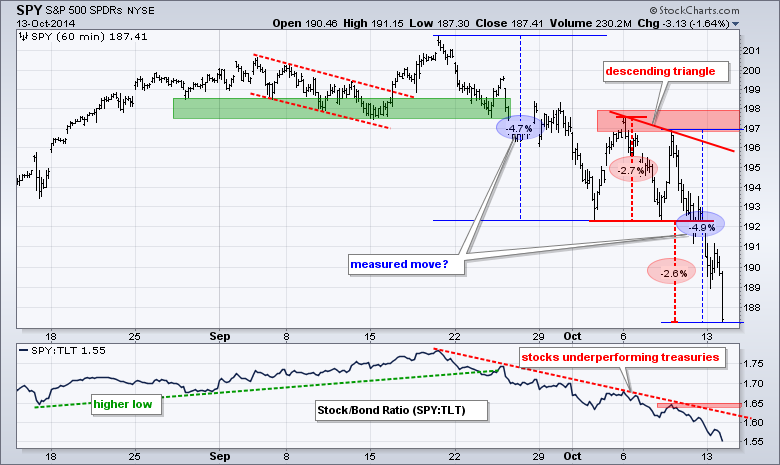
SPY plunged below 188 to become even more oversold and hit two downside targets. The first decline was 4.7% and a measured moved after the early October consolidation would target another 4.7% decline. SPY is down 4.9% from the last peak, which is close enough. The second pattern is a descending triangle with a 2.7% projected decline. SPY fell 2.6% and pretty much hit this target as well. The combination of targets and oversold conditions could give way to an oversold bounce. Careful: it is a falling knife and earnings season is kicking in this week.

**************************************************************
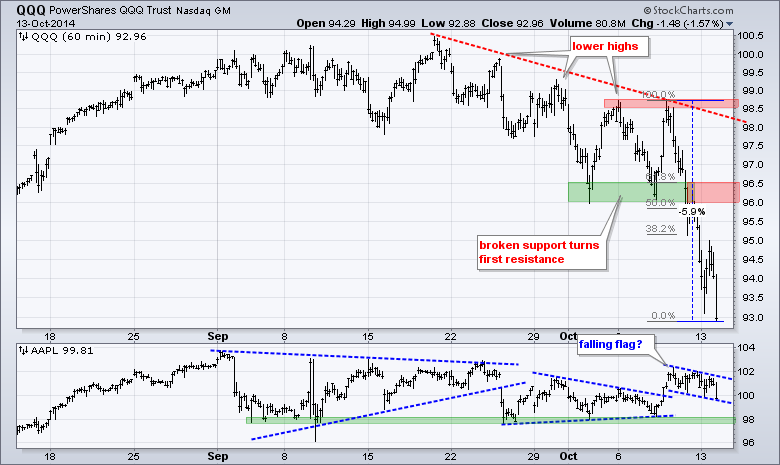
QQQ extended its decline and is now down almost 6% in three days. The ETF is way oversold and ripe for a bounce, but buying here is catching a falling knife. Broken support turns into resistance in the 96-96.5 area. Also notice that the 50-62% retracement zone extends to this area. I will leave key resistance in the 98.5 area for now. Apple has a falling flag working and held up quite well over the last few days. A break above 102 would be bullish. Note that Intel reports after the close today.

**************************************************************
IWM remains within a falling channel and clear downtrend. The ETF, however, did show some relative strength on Monday and closed above the morning low. One day does not a trend make, but we should keep an eye on this. With all the international fears (Ebola, Europe, strong Dollar), some home grown small-caps may offer an alternative. The channel trend line marks first resistance and the reaction high marks key resistance at 109.

**************************************************************
No change. The 20+ YR T-Bond ETF (TLT) remains in a steep uptrend defined by the Raff Regression Channel. The lower trend line ends just above 118.5, but I would like more of a buffer and will leave key support in the 116.5-117 area for now. This support zone jibes with the resistance levels set for the 10-YR Treasury Yield ($TNX) and 5-year Treasury Yield ($FVX). Strength in Treasuries favors a risk-off environment and this negative for stocks.

**************************************************************
No change. The US Dollar ETF (UUP) pulled back last week, but found support in the 22.6-22.7 area and bounced on Thursday-Friday. This reaction low affirms support and keeps the uptrend alive. Even though a break would be short-term negative, I would still view any weakness as a pullback within a bigger uptrend. The indicator window shows the Euro Index ($XEU) hitting resistance in the 127.5 area.

**************************************************************
No change. The USO Oil Fund (USO) sank to new lows even as the Dollar pulled back and remains in a strong downtrend. Oversold simply becomes even more oversold. The last support break in the 34 area turns first resistance. I will leave key resistance in the 35.5-35.8 area for now.

**************************************************************
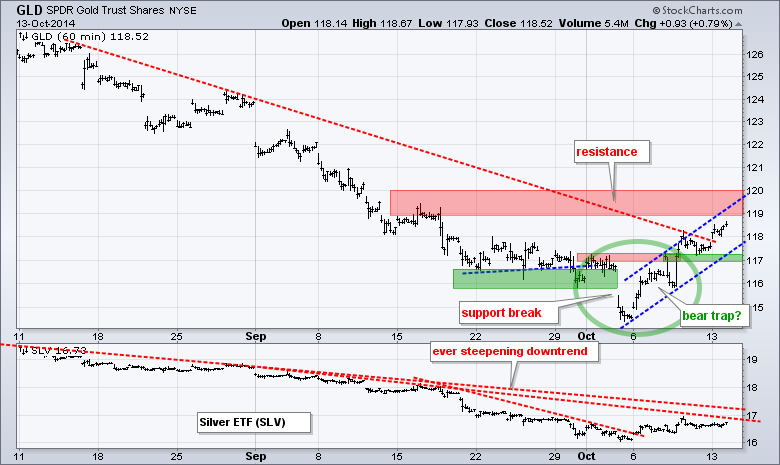
The Gold SPDR (GLD) broke support in early October, stalled for a day and then moved back above the support break. The combination looks like a bear trap, which is the first positive we have seen in months. I still view this as an oversold bounce within a bigger downtrend though and will keep key resistance in the 119-120 area. Chartists can mark first support at 116.8. A move below this level would break the early October trend line and reverse the five day upswing.

***************************************************************
Key Reports and Events (all times Eastern):
Wed - Oct 15 - 07:00 - MBA Mortgage Index
Wed - Oct 15 - 08:30 - Retail Sales
Wed - Oct 15 - 08:30 - Producer Price Index (PPI)
Wed - Oct 15 - 08:30 - Empire State Manufacturing
Wed - Oct 15 - 14:00 - Fed's Beige Book
Thu - Oct 16 - 08:30 - Initial Jobless Claims
Thu - Oct 16 - 09:15 - Industrial Production
Thu - Oct 16 - 10:00 - Philadelphia Fed
Thu - Oct 16 - 10:00 - NAHB Housing Market Index
Thu - Oct 16 - 10:30 - Natural Gas Inventories
Thu - Oct 16 - 11:00 - Crude Oil Inventories
Fri - Oct 17 - 08:30 - Housing Starts/Building Permits
Fri - Oct 17 - 09:55 - Michigan Sentiment
There are no chart setups today because the pickings are very slim. It is earnings season for most stocks and I do not like to trade a stock ahead of its earnings. In addition, stocks are in clear downtrend, but very oversold and ripe for a bounce that could prove volatile. Seems best to stand aside for a week or so.
This commentary and charts-of-interest are designed to stimulate thinking. This analysis is not a recommendation to buy, sell, hold or sell short any security (stock ETF or otherwise). We all need to think for ourselves when it comes to trading our own accounts. First, it is the only way to really learn. Second, we are the only ones responsible for our decisions. Think of these charts as food for further analysis. Before making a trade, it is important to have a plan. Plan the trade and trade the plan. Among other things, this includes setting a trigger level, a target area and a stop-loss level. It is also important to plan for three possible price movements: advance, decline or sideways. Have a plan for all three scenarios BEFORE making the trade. Consider possible holding times. And finally, look at overall market conditions and sector/industry performance.


