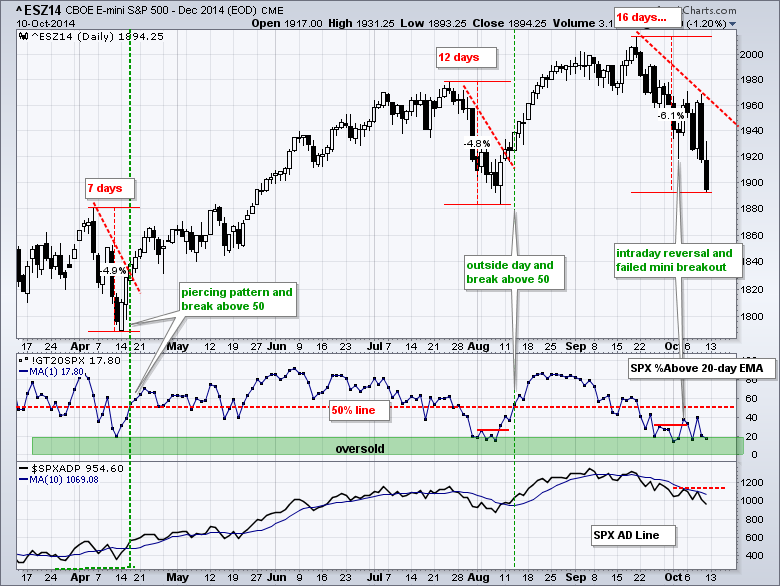
Stocks surged on Wednesday, but this surge failed miserably as the major index ETFs plunged to new lows for the month on Friday. The S&P 500 opened at 1961 on Thursday, closed of 1894 on Friday and fell 3.4% in two days. The index is once again oversold with a 6.1% decline in sixteen days, but the trend is clearly down and the markets favor risk off right now. Treasuries are outperforming stocks. Offensive sectors are lagging defensive sectors. The consumer discretionary, technology and industrials sectors show relative weakness, while the consumer staples, healthcare and utilities sectors show relative strength. The Dollar is the favored currency right now and this favors risk aversion. Commodities perform well in a risk-taking environment and they are weak for the most part. Even though the seasonal pattern for the S&P 500 favors the bulls in November and December, the correction dominates right now and the immediate trend is down. The chart below shows the S&P 500 %Above 20-day EMA (!GT20SPX) falling back below 20%. The mini breakout on 3-Oct failed and I am now watching the 50% line for a breakout that would be short-term bullish. The S&P 500 AD Line remains in a downtrend since early September and a break above the October highs is needed to reverse this indicator.
**This chart analysis is for educational purposes only, and should not
be construed as a recommendation to buy, sell or sell-short said securities**
**************************************************************
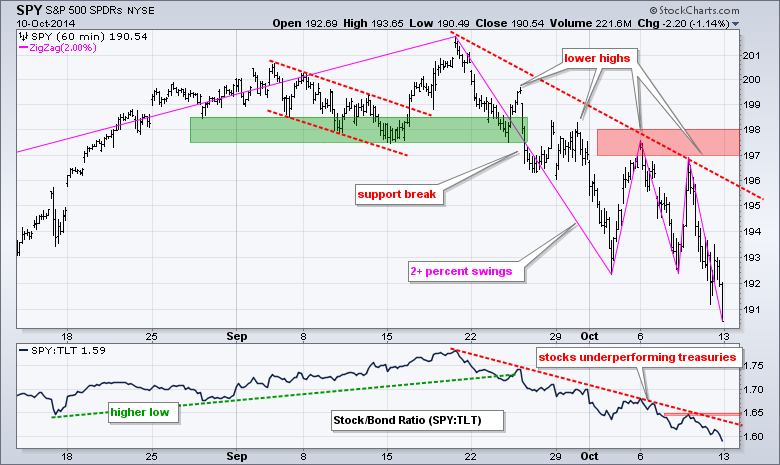
SPY made two attempts to bounce, but failed in the 197-198 area twice and finished the week below 191. Recent swings have been quite volatile with five 2+ percent swings over the last three weeks. Each swing, however, results in a lower high and a lower low. This means the downtrend remains in play with key resistance in the 197-198 area for now. The indicator window shows the SPY:TLT ratio moving to a new low for the move as stocks underperform bonds.
**************************************************************
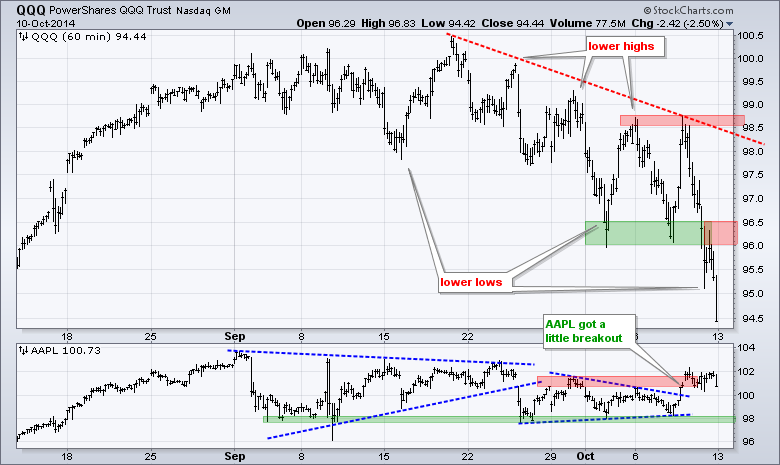
QQQ got a little breakout with the surge above 100, but it did not help QQQ as the ETF failed at resistance and plunged to a new low for the month. Weakness in semis weighed on the tech sector. Broken support turns first resistance in the 96-96.5 area and I will leave key resistance at 98.8 for now.
**************************************************************
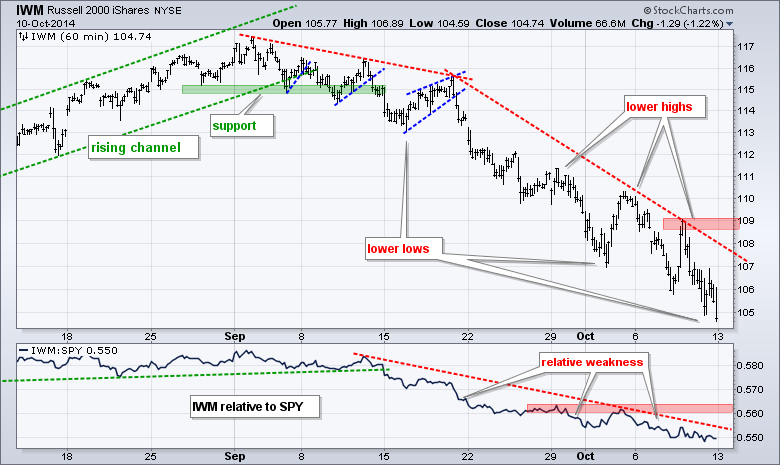
IWM started with a relatively modest decline in early September and accelerated lower after the plunge below 113 on 22-Sept. It is been nothing but lower lows and lower highs ever since. The last reaction high marks resistance at 109. The indicator window shows the IWM:SPY ratio moving to a new low last week as small-caps continue to underperform large-caps.
**************************************************************
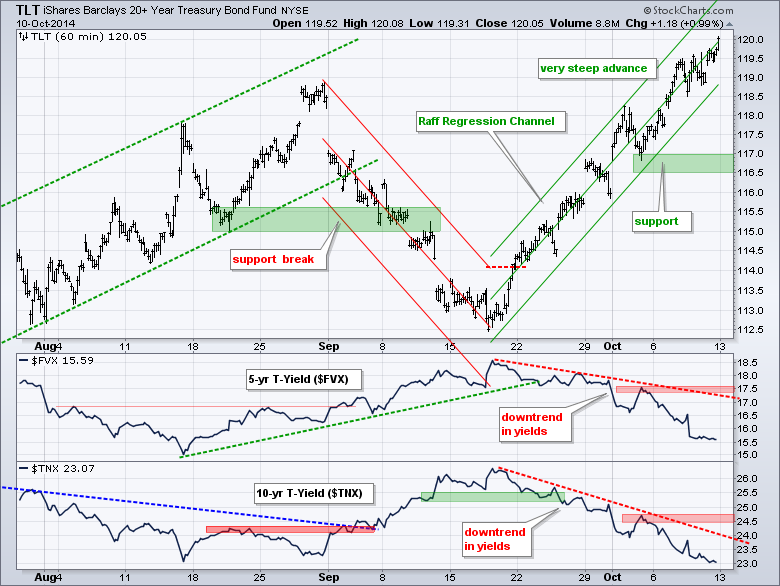
The 20+ YR T-Bond ETF (TLT) remains in a steep uptrend defined by the Raff Regression Channel. The lower trend line ends just above 118.5, but I would like more of a buffer and will leave key support in the 116.5-117 area for now. This support zone jibes with the resistance levels set for the 10-YR Treasury Yield ($TNX) and 5-year Treasury Yield ($FVX). Strength in Treasuries favors a risk-off environment and this negative for stocks.
**************************************************************
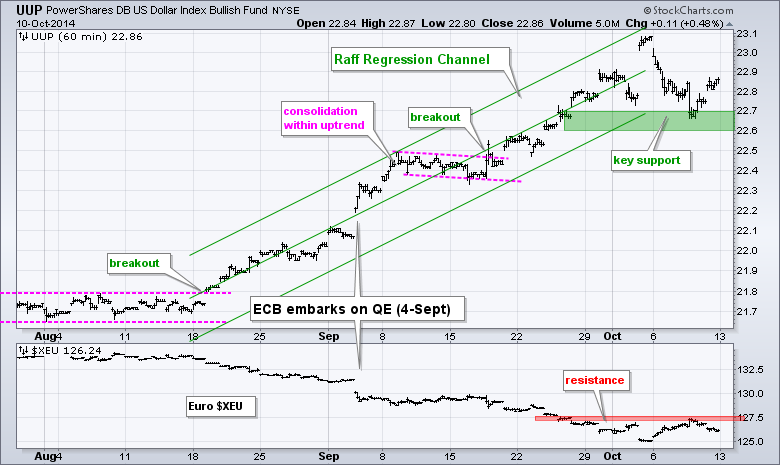
The US Dollar ETF (UUP) pulled back last week, but found support in the 22.6-22.7 area and bounced on Thursday-Friday. This reaction low affirms support and keeps the uptrend alive. Even though a break would be short-term negative, I would still view any weakness as a pullback within a bigger uptrend. The indicator window shows the Euro Index ($XEU) hitting resistance in the 127.5 area.
**************************************************************
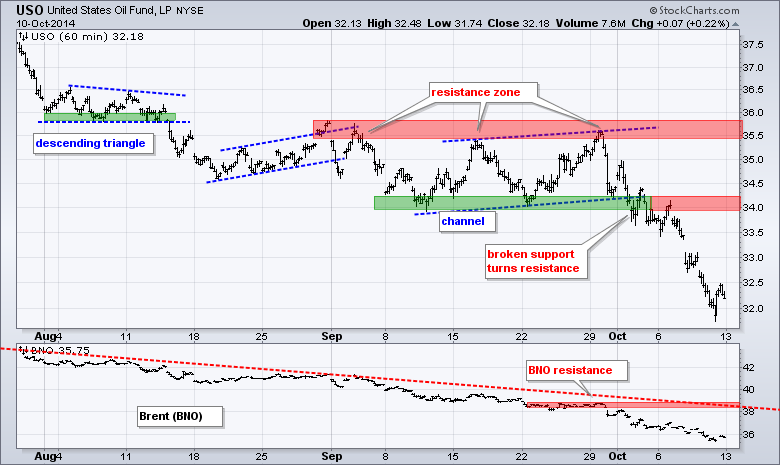
The USO Oil Fund (USO) sank to new lows even as the Dollar pulled back and remains in a strong downtrend. Oversold simply becomes even more oversold. The last support break in the 34 area turns first resistance. I will leave key resistance in the 35.5-35.8 area for now.
**************************************************************
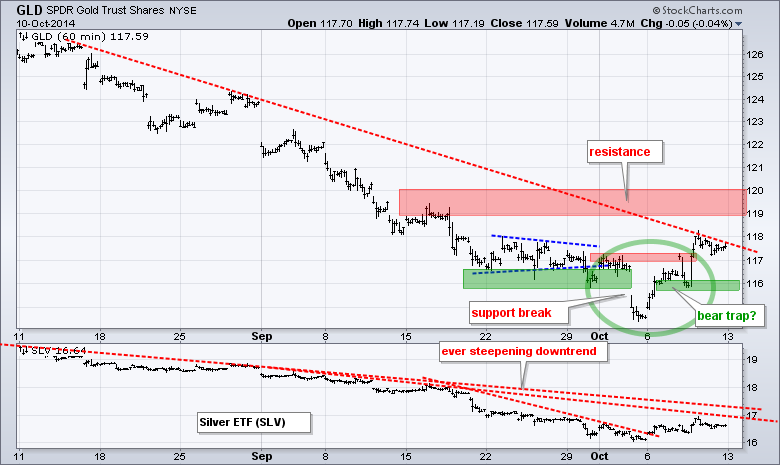
The Gold SPDR (GLD) broke support in early October, stalled for a day and then moved back above the support break. The combination looks like a bear trap, which is the first positive we have seen in months. I still view this as an oversold bounce within a bigger downtrend though and will keep key resistance in the 119-120 area. Chartists can mark support in the 116 area. A move back below the mid week low would negate the bear trap.
***************************************************************
Key Reports and Events (all times Eastern):
Wed - Oct 15 - 07:00 - MBA Mortgage Index
Wed - Oct 15 - 08:30 - Retail Sales
Wed - Oct 15 - 08:30 - Producer Price Index (PPI)
Wed - Oct 15 - 08:30 - Empire State Manufacturing
Wed - Oct 15 - 14:00 - Fed's Beige Book
Thu - Oct 16 - 08:30 - Initial Jobless Claims
Thu - Oct 16 - 09:15 - Industrial Production
Thu - Oct 16 - 10:00 - Philadelphia Fed
Thu - Oct 16 - 10:00 - NAHB Housing Market Index
Thu - Oct 16 - 10:30 - Natural Gas Inventories
Thu - Oct 16 - 11:00 - Crude Oil Inventories
Fri - Oct 17 - 08:30 - Housing Starts/Building Permits
Fri - Oct 17 - 09:55 - Michigan Sentiment
Chart Setups on Tuesday and Thursday.
This commentary and charts-of-interest are designed to stimulate thinking. This analysis is not a recommendation to buy, sell, hold or sell short any security (stock ETF or otherwise). We all need to think for ourselves when it comes to trading our own accounts. First, it is the only way to really learn. Second, we are the only ones responsible for our decisions. Think of these charts as food for further analysis. Before making a trade, it is important to have a plan. Plan the trade and trade the plan. Among other things, this includes setting a trigger level, a target area and a stop-loss level. It is also important to plan for three possible price movements: advance, decline or sideways. Have a plan for all three scenarios BEFORE making the trade. Consider possible holding times. And finally, look at overall market conditions and sector/industry performance.


