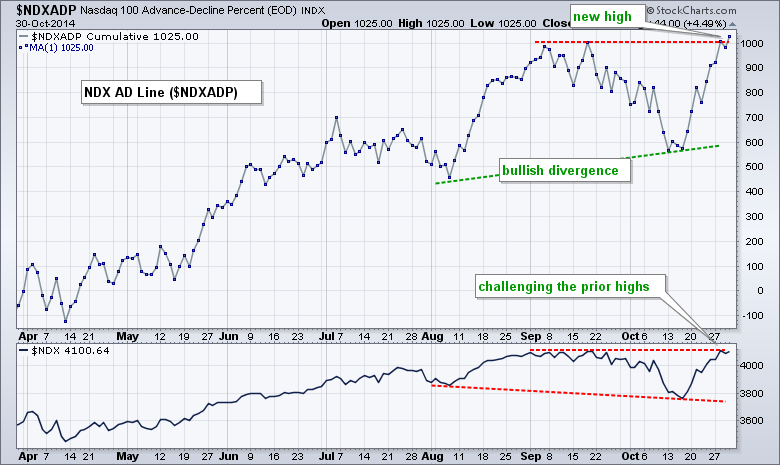
The major index ETFs notched another gain with the Dow Diamonds (DIA) leading the way (+1.30%). The gains in the other major index ETFs were, however, modest. Stock futures are pointing sharply higher after the Bank of Japan announced another round of quantitative easing. The European Central Bank (ECB) is next for QE and the Fed has just stopped QE. This is Dollar bullish and perhaps Treasury bond bearish. Healthcare and utilities lead the market as both sector SPDRs hit new highs. Semis were weak as Intel fell sharply. Gold miners were slammed as gold fell sharply, which was not a surprise after last week's short-term trend reversal. The chart below shows the Nasdaq 100 AD Line ($NDXADP) hitting a new high to affirm the long-term uptrend. Also notice that the AD Line held above its early August low and formed a big bullish divergence in mid October. The Nasdaq 100 is challenging its September (closing) highs.
**This chart analysis is for educational purposes only, and should not
be construed as a recommendation to buy, sell or sell-short said securities**
**************************************************************
Overview:
SPY, QQQ and IWM remain in clear uptrends and well above support.
UUP bounced off broken resistance and held these gains (uptrend).
TLT bounced, but remains in a short-term downtrend.
USO fell back and remains stuck in a consolidation (trading range).
GLD plunged again and extended its long-term downtrend.
No change. SPY has now gapped up four times in the last three weeks and each gap has held. The latest gap came with the open above 196.5 and the ETF closed above 198. Even though this uptrend may seem extended, the trend trumps and the trend is clearly up. The Raff Regression Channel, Friday-Monday lows and a buffer mark key support at 194. The indicator window shows SPY outperforming TLT since October 15th.

**************************************************************
No change. QQQ is up over 10% in three weeks and near a 52-week high. The condition is overbought and resistance is possible near the September highs, but the trend is up and strong. Even though these lines are quite steep, I put on a Raff Regression Channel to define this advance. I will mark key support in the 97.5-98 area.

**************************************************************
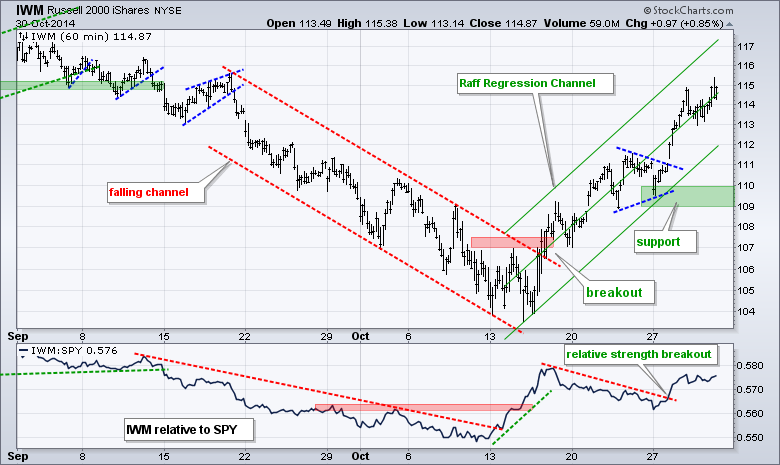
No change. IWM took charge with a gap up and 2.85% surge that blew through the 50-62% retracement zone, which I have since removed. The ETF may seem overbought again, but this overbought condition is secondary to the overall uptrend. The Raff Regression Channel, Monday's low and a buffer mark key support in the 109-110 area. The indicator window shows the IWM:SPY ratio breaking out as small-caps outperform large-caps.

**************************************************************
QE has stopped, but the Fed remains dovish overall. Nevertheless, the Fed is making an effort to return to normalcy and that means Treasury yields should be a lot higher in the future. When this will happen is open for debate. In any case, the 20+ YR T-Bond ETF (TLT) is in short-term downtrend defined by the Raff Regression Channel and I am marking resistance at 121. The 5-year Treasury Yield ($FVX) surged to 1.6% and has been trending higher since 15-Oct.

**************************************************************
The end of QE is bullish for the Dollar. Note that the Fed has ended QE and the European Central Bank (ECB) is threatening QE. This is Dollar bullish and Euro bearish. The US Dollar ETF (UUP) held its support zone and surged to affirm support at 22.60. The Euro Index ($XEU) held resistance and plunged below 127.

**************************************************************
The USO Oil Fund (USO) made a move with a break above 31 to negate the pennant break down. There are two positives at work here. First, Monday's plunge below 30.5 did not hold. Second, the ETF followed thru with a move above 31 and this move is holding so far. Oil is due for a bounce, but that does not guarantee one. Look for a break above 31.7 to fully reverse the short-term downtrend and target a move to the mid 30s. The indicator window shows the US Brent Oil ETF (BNO) challenging resistance at 35.

**************************************************************
Gold gave us a little preview of the Fed policy statement by breaking down last week. This break held as GLD consolidated in the 118 area. GLD continued lower after the Fed announced the long awaited end to quantitative easing, which is Dollar bullish and bullion bearish. I will not move key resistance to 119.

***************************************************************
Key Reports and Events (all times Eastern):
Fri - Oct 31 - 08:30 - Personal Income & Spending
Fri - Oct 31 - 08:30 - PCE Prices
Fri - Oct 31 - 09:45 - Chicago PMI
Fri - Oct 31 - 09:55 - Michigan Sentiment
Charts of Interest are on Tuesdays and Thursdays.
This commentary and charts-of-interest are designed to stimulate thinking. This analysis is not a recommendation to buy, sell, hold or sell short any security (stock ETF or otherwise). We all need to think for ourselves when it comes to trading our own accounts. First, it is the only way to really learn. Second, we are the only ones responsible for our decisions. Think of these charts as food for further analysis. Before making a trade, it is important to have a plan. Plan the trade and trade the plan. Among other things, this includes setting a trigger level, a target area and a stop-loss level. It is also important to plan for three possible price movements: advance, decline or sideways. Have a plan for all three scenarios BEFORE making the trade. Consider possible holding times. And finally, look at overall market conditions and sector/industry performance.

