Breadth behind the most recent advance was quite strong as the AD Lines for the S&P 500, S&P 1500 and Nasdaq 100 recorded new highs. Of these three, notice that the S&P 500 AD Line held its August low and the Nasdaq 100 AD Line held above its August lows. These two clearly held up the best during the October decline. The AD Lines for the S&P MidCap 400 and the S&P Small-Cap 600 have yet record new highs, but the breadth surge over the last three weeks was quite impressive.
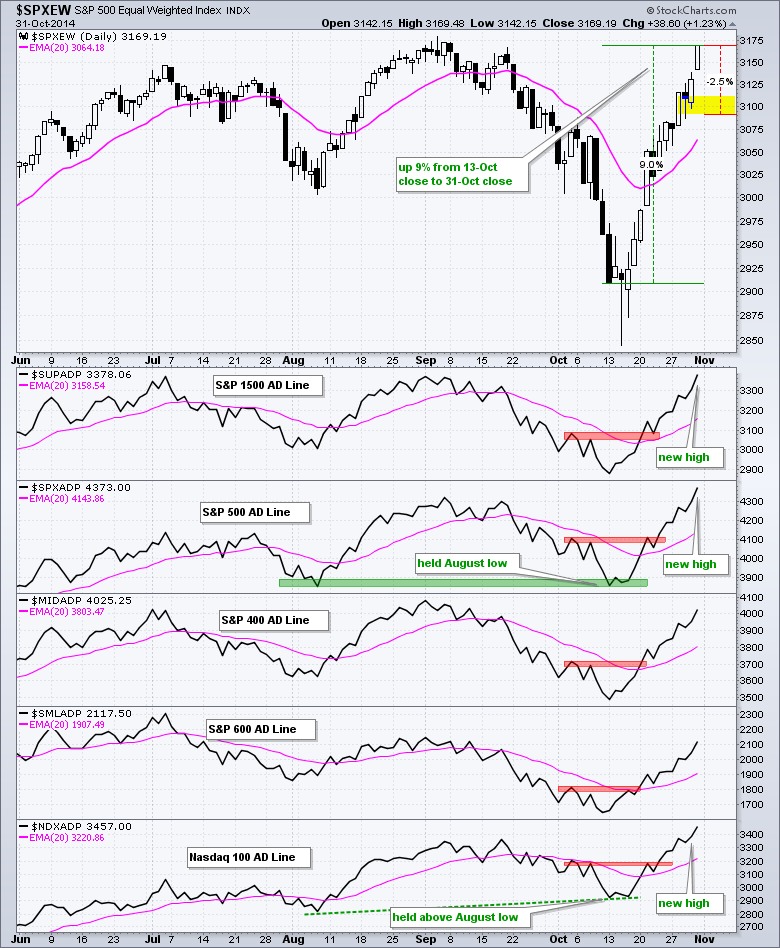
The S&P 500 Equal-Weight Index ($SPXEW) is currently up 9% over the last three weeks and near the September highs. This area may act as resistance and the index is short-term overbought. The combination could give way to a small pullback or consolidation. A 2.5% pullback would extend to the 3100 area. At this point, we are in the middle of an up move and simply waiting for the next setup.
**This chart analysis is for educational purposes only, and should not
be construed as a recommendation to buy, sell or sell-short said securities**
**************************************************************
Overview:
SPY, QQQ and IWM remain in clear uptrends.
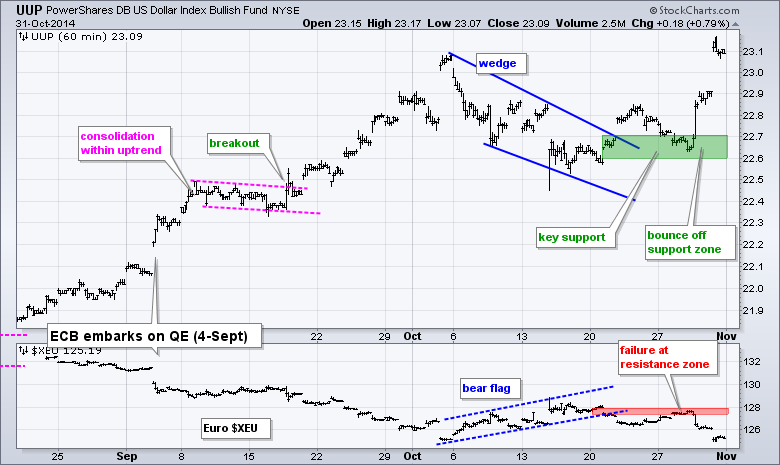
UUP hit a new high to affirm its uptrend.
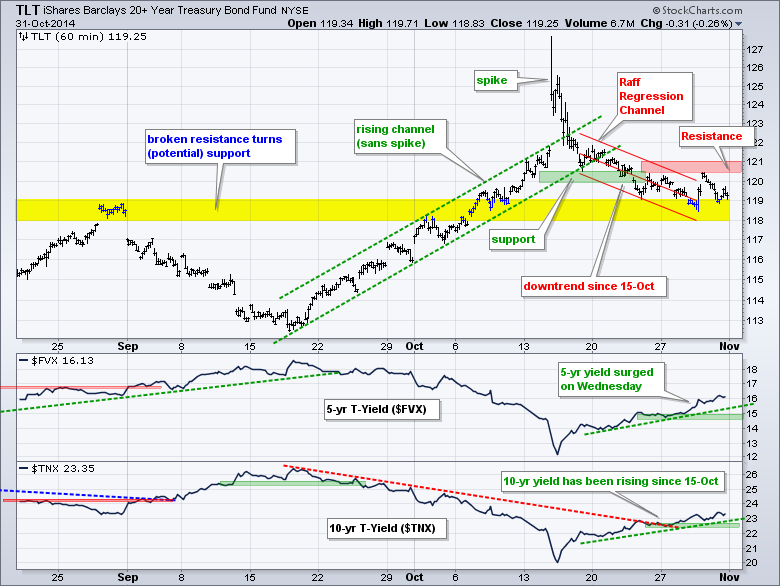
TLT stalled last week, but remains in a short-term downtrend.
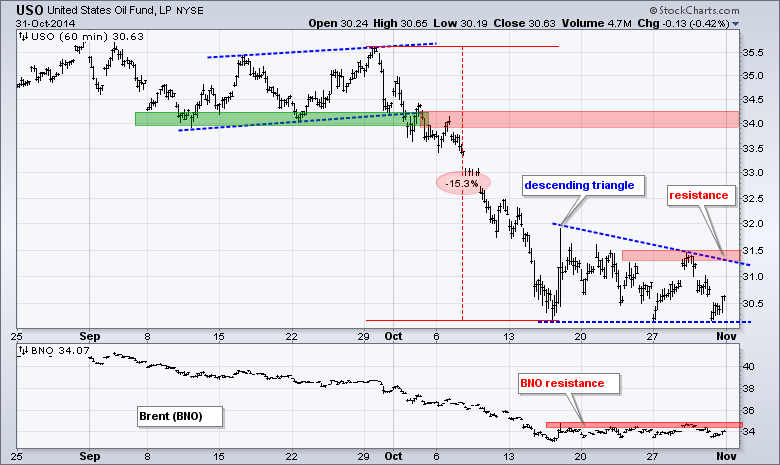
USO could be forming a descending triangle as it consolidates.
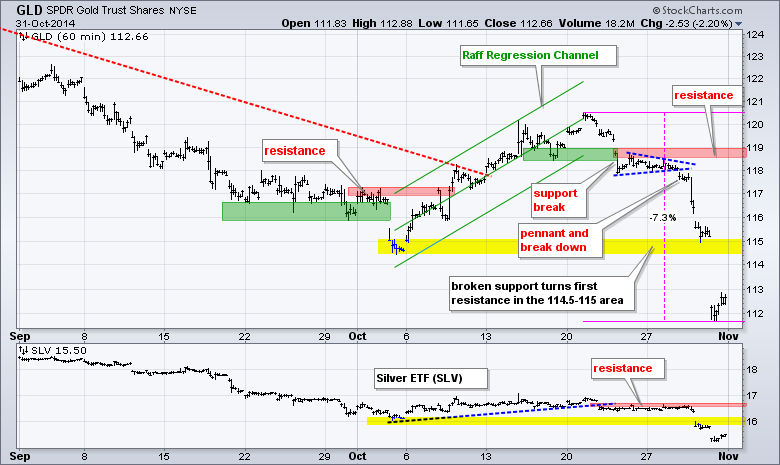
GLD is oversold, but in a short-term and long-term downtrend.
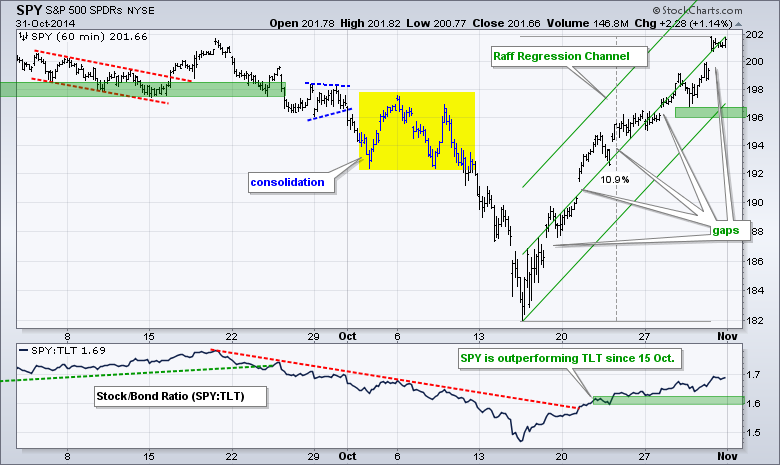
SPY gapped up yet again and closed above the September closing high. The ETF remains in a strong uptrend that is punctuated by five gaps in the last eleven days. The Raff Regression Channel defines this uptrend with support marked at 196.
**************************************************************
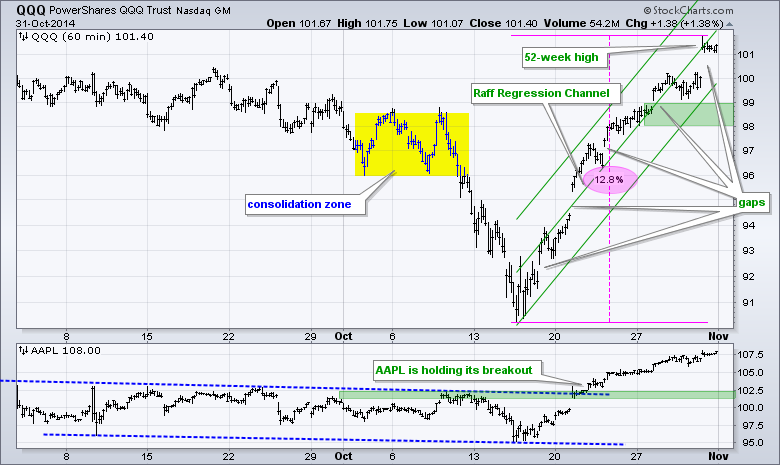
QQQ gapped up and hit a 52-week high on Friday to extend the short-term uptrend. Even though the ETF is overbought after a 12 percent run in less than 3 weeks, there is no denying this uptrend. The reward-to-risk ratio and a buffer mark support in the 98-99 area.
**************************************************************
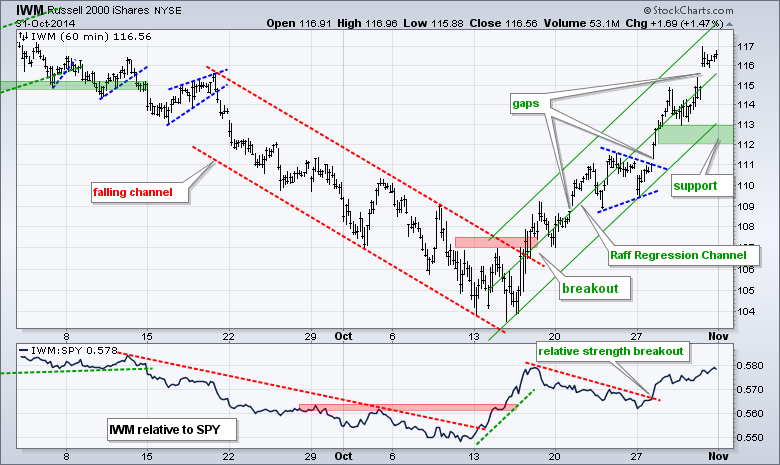
IWM gapped up and closed at its highest level since early September. This marks at least the third gap in the last three weeks. The Raff Regression Channel and a buffer mark first support in the 112-113 area. The indicator window shows IWM outperforming SPY since the price relative broke out early last week.
**************************************************************
It is a big week for the 20+ YR T-Bond ETF (TLT) because there is always a slew of economic reports the first week of the month and the employment report is Friday. TLT remains in a short-term downtrend, while the 10-YR Treasury Yield ($TNX) and 5-year Treasury Yield ($FVX) are in short-term uptrends. I expect the economic reports to be more positive than negative and this could weigh on Treasuries. I will mark resistance at 121 and stay negative as long as this level holds.
**************************************************************
The Dollar surged as the Yen and Euro plunged on Friday. The US Dollar ETF (UUP) hit a new high to affirm the uptrend and support in the 22.6-22.7 area. As with stocks, the Dollar may be short-term overbought, but the clear uptrend carries more weight than overbought conditions. The Euro Index ($XEU) is trading near its October low with resistance at 128.
**************************************************************
The USO Oil Fund (USO) continues to consolidate around the 31 level. The prior move was clearly down and a consolidation within a downtrend is usually a bearish continuation pattern, as is a descending triangle. This gives oil a bearish bias right now and I would remain with that bias as long as resistance at 31.50 holds. A breakout at 31.50 would be short-term bullish and argue for a corrective bounce back to the 34 area. The indicator window shows the US Brent Oil ETF (BNO) with resistance at 35.
**************************************************************
Gold is as oversold as the Dollar is overbought, but the Gold SPDR (GLD) remains in a clear downtrend and any bounce would be deemed a counter-trend move. GLD fell over 7% in less than two weeks and broke below the early October low. This broken support level turns first resistance. I will leave key resistance in the 118.5-119 area for now.
***************************************************************
Key Reports and Events (all times Eastern):
Mon - Nov 03 - 10:00 - ISM Manufacturing Index
Mon - Nov 03 - 10:00 - Construction Spending
Mon - Nov 03 - 14:00 - Auto Sales/Truck Sales
Tue - Nov 04 - 10:00 - Factory Orders
Wed - Nov 05 - 07:00 - MBA Mortgage Index
Wed - Nov 05 - 08:15 - ADP Employment Report
Wed - Nov 05 - 10:00 - ISM Services
Wed - Nov 05 - 10:30 - Crude Oil Inventories
Thu - Nov 06 - 07:30 - Challenger Jobs Report
Thu - Nov 06 - 08:30 - Initial Jobless Claims
Thu - Nov 06 - 10:30 - Nat Gas Inventories
Fri - Nov 07 - 08:30 - Employment Report
Charts of Interest are on Tuesdays and Thursdays.
This commentary and charts-of-interest are designed to stimulate thinking. This analysis is not a recommendation to buy, sell, hold or sell short any security (stock ETF or otherwise). We all need to think for ourselves when it comes to trading our own accounts. First, it is the only way to really learn. Second, we are the only ones responsible for our decisions. Think of these charts as food for further analysis. Before making a trade, it is important to have a plan. Plan the trade and trade the plan. Among other things, this includes setting a trigger level, a target area and a stop-loss level. It is also important to plan for three possible price movements: advance, decline or sideways. Have a plan for all three scenarios BEFORE making the trade. Consider possible holding times. And finally, look at overall market conditions and sector/industry performance.


