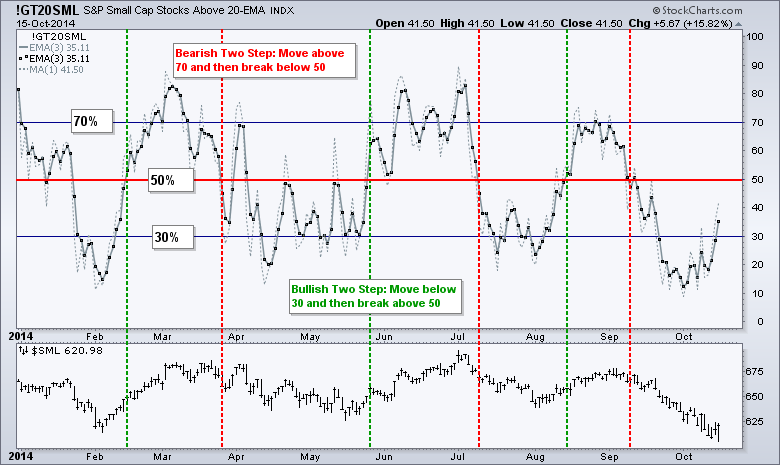
Stocks plunged in early trading and then bounced in the afternoon. After a whole lot of volatility, stocks finished mixed overall. The Russell 2000 iShares and the Russell MicroCap iShares gained over 1% and led the rebound. The S&P 500 SPDR and Nasdaq 100 ETF closed lower on the day. Seven of the nine sector SPDRs were down, six of the nine equal-weight sector ETFs were down and three of the nine small-caps sector ETFs were down. The small-cap sectors held up the best. Energy led the way overall, while the consumer discretionary held up quite well. The Home Construction iShares (ITB) surged over 2% on the day. Banks were weak as the Regional Bank SPDR (KRE) fell over 2%. Falling yields are negative for the smaller banks. The chart below shows the Small-Cap Percent Above 20-day EMA (!GT20SML) as a 3-day EMA (dots) and as daily values (thin dashed line). I applied a 3-day EMA because this indicator is quite jumpy and prone to whipsaws. Basically, there is a bullish signal when the 3-day EMA has been below 30 (oversold) and then moves above 50. The 3-day EMA just moved back above 30 and is at an 18 day high. Notice that the actual indicator is at 41.50, which means more than 40% of the stocks in the S&P Small-Cap 600 are above their 20-day EMA. This indicator is perking up and showing some resilience.
**This chart analysis is for educational purposes only, and should not
be construed as a recommendation to buy, sell or sell-short said securities**
**************************************************************
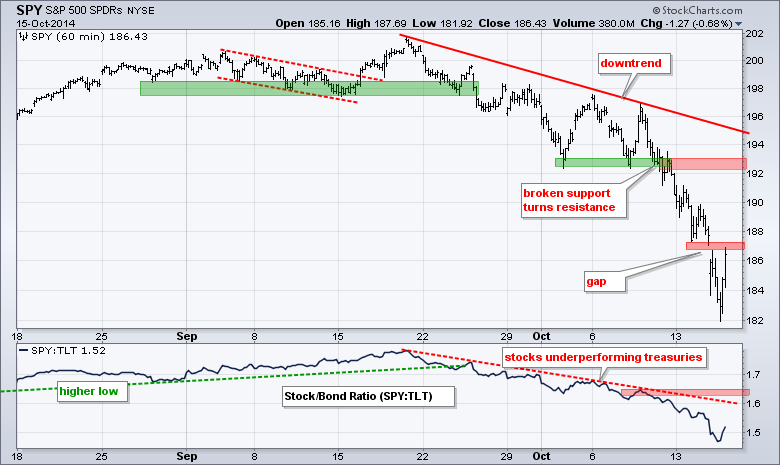
SPY extended its downtrend with a gap and move to 182. This level did not hold long as SPY surged in the afternoon and closed above 186. The gap zone has yet to be filled and this area could be considered first resistance. I will leave key resistance at 193 (broken support).
**************************************************************
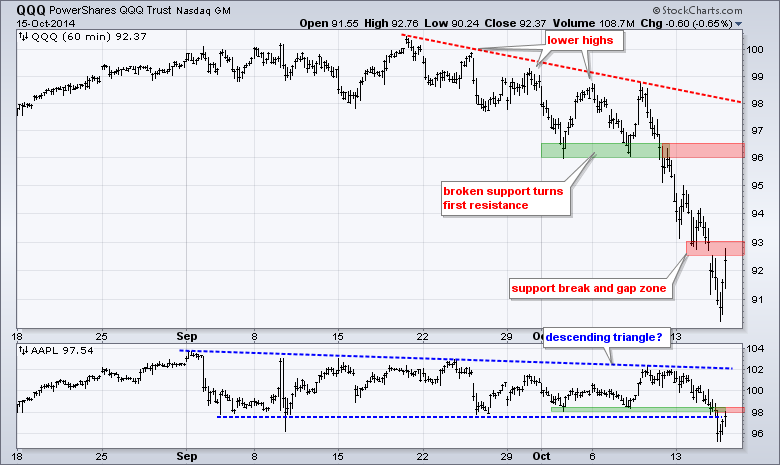
QQQ gapped down and plunged below 91, but caught an afternoon bid and closed at 92.37. The ETF finished right in the first resistance zone. The gap and mini support break mark first resistance at 93. A break here could extend the oversold bounce. Key resistance remains at 96.5 for now. Apple broke support and broken support marks first resistance at 98.2
**************************************************************
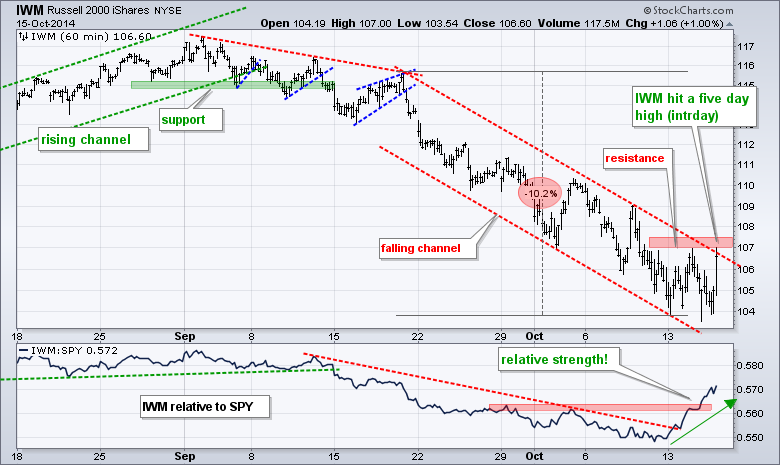
IWM is showing relative and absolute strength over the last five days. On the daily charts, IWM closed at its highest close in five days. On the intraday chart, IWM hit a five day high yesterday. The price relative (IWM:SPY ratio) turned up this week and broke above its early October high. IWM remains within a falling channel, but the only picture is the most positive of the major index ETFs. Look for a break above 107.5 to reverse the short-term downtrend.
**************************************************************
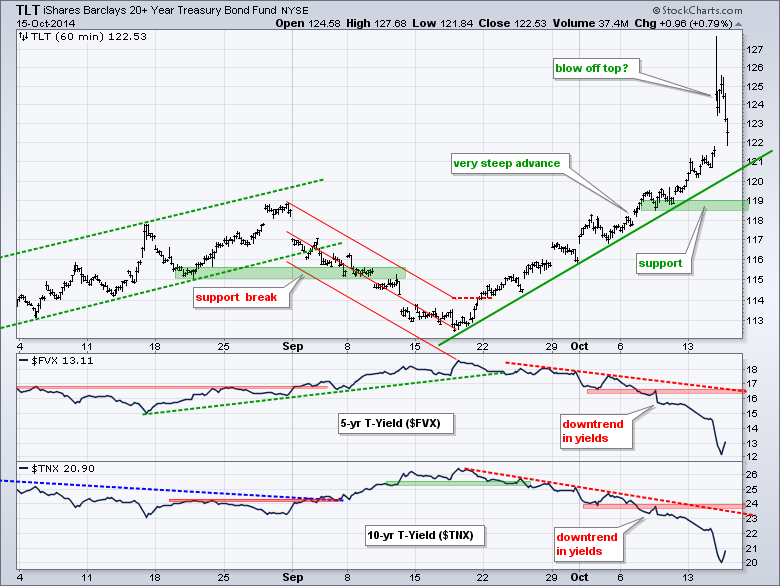
The 20+ YR T-Bond ETF (TLT) gapped up and surged above 127 in the morning. This surged did not hold as the ETF closed below 123. The overall trend remains up, but this is looking like a blow off top, which is the opposite of a selling climax. Treasury yields remain in downtrends as the 10-YR Treasury Yield ($TNX) touched 2% and the 5-year Treasury Yield ($FVX) hit 1.2%.
**************************************************************
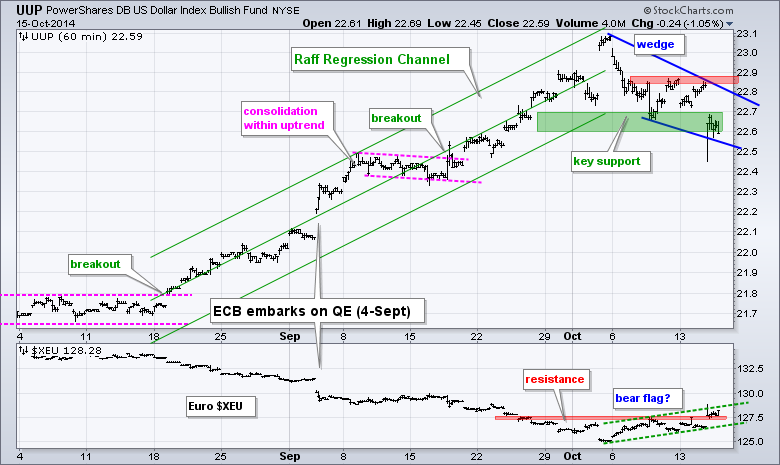
The US Dollar ETF (UUP) fell back with a falling wedge as the Euro Index ($XEU) bounced with a rising flag. The falling wedge is typically a bullish continuation pattern, while the rising flag is a bearish continuation pattern. A break above 22.9 would be Dollar bullish, while a break below 126.2 would be Euro bearish.
**************************************************************
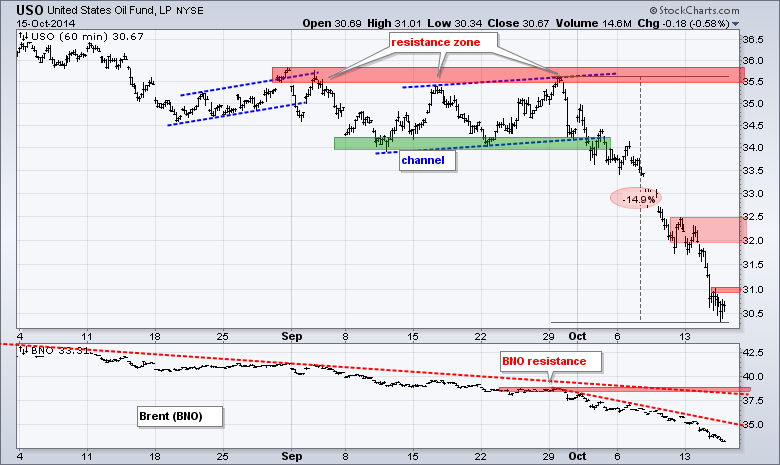
The USO Oil Fund (USO) remains very oversold and in a strong downtrend. The only play here is for an oversold bounce, which is akin to catching a falling knife. A break above 31.1 could trigger this bounce and I would then expect resistance in the 32-32.5 area.
**************************************************************
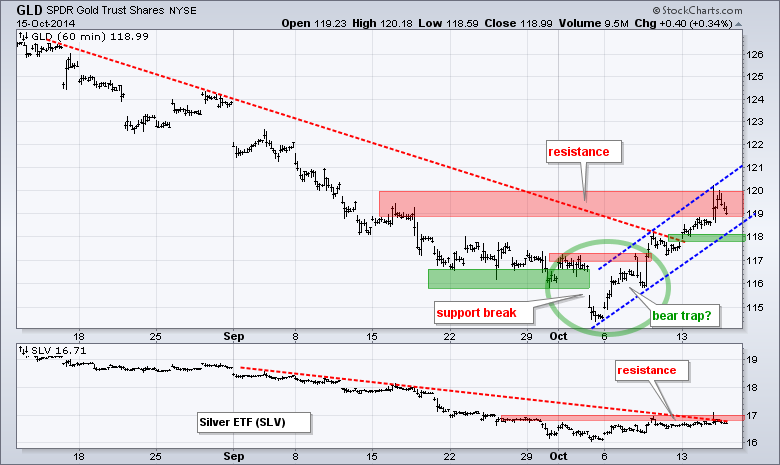
The Gold SPDR (GLD) is at an interesting juncture: resistance in a long-term downtrend. Even though the ETF sprung a bear trap with the surge back above 117, the advance still looks like a counter trend move because a rising flag formed. A move below the lower trend line and support at 117.8 would reverse the rising flag and signal a continuation of the long-term downtrend.
***************************************************************
Key Reports and Events (all times Eastern):
Thu - Oct 16 - 08:30 - Initial Jobless Claims
Thu - Oct 16 - 09:15 - Industrial Production
Thu - Oct 16 - 10:00 - Philadelphia Fed
Thu - Oct 16 - 10:00 - NAHB Housing Market Index
Thu - Oct 16 - 10:30 - Natural Gas Inventories
Thu - Oct 16 - 11:00 - Crude Oil Inventories
Fri - Oct 17 - 08:30 - Housing Starts/Building Permits
Fri - Oct 17 - 09:55 - Michigan Sentiment
There are no chart setups today because the pickings are very slim. It is earnings season and I do not like to trade a stock ahead of its earnings. In addition, the major index ETFs are in clear downtrends, but very oversold and ripe for a bounce that could prove volatile. Seems best to stand aside for a week or so.
This commentary and charts-of-interest are designed to stimulate thinking. This analysis is not a recommendation to buy, sell, hold or sell short any security (stock ETF or otherwise). We all need to think for ourselves when it comes to trading our own accounts. First, it is the only way to really learn. Second, we are the only ones responsible for our decisions. Think of these charts as food for further analysis. Before making a trade, it is important to have a plan. Plan the trade and trade the plan. Among other things, this includes setting a trigger level, a target area and a stop-loss level. It is also important to plan for three possible price movements: advance, decline or sideways. Have a plan for all three scenarios BEFORE making the trade. Consider possible holding times. And finally, look at overall market conditions and sector/industry performance.


