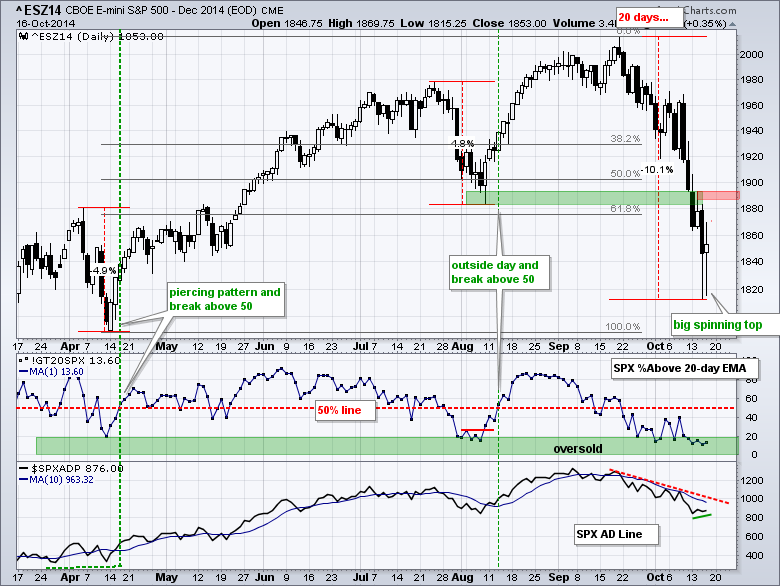
It was another volatile day for stocks and the major index ETFs finished mixed. Once again, the Russell 2000 iShares and Russell MicroCap iShares led the way higher with 1+ percent gains. Energy led the sectors higher and got a nice oversold bounce. Eight of the nine small-cap sectors were higher. The SmallCap Consumer Staples ETF (PSCC) was the only loser. The chart below shows the e-mini forming a big spinning top on Thursday, which is the ultimate in indecision. The contract opened at 1846, plunged to 1815 in the morning, surged to 1870 in the afternoon and settled back near the close (1853). The close was around 6 points higher than the open and the high-low range was a whopping 55 points. Notice that the contract dipped below 1820 twice in the last two days and recovered. It is still a dangerous time for trading because of volatility, but the S&P 500 is finding support near the May lows and this could give way to an oversold bounce. Broken support marks next resistance in the 1890 area. The first indicator shows the S&P 500 Percent Above 20-day EMA (!GT20SPX) in oversold territory (below 20%) and a move above 50% is needed to trigger a short-term bullish signal.
**This chart analysis is for educational purposes only, and should not
be construed as a recommendation to buy, sell or sell-short said securities**
**************************************************************
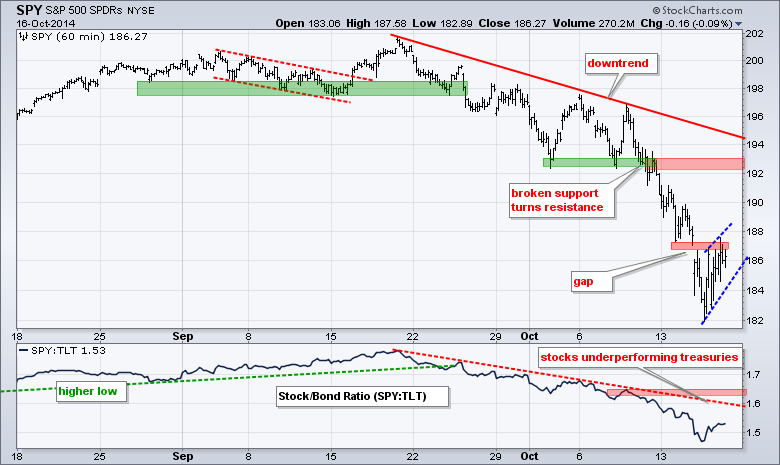
SPY plunged from 196 to 182 and then got a small oversold bounce over the last two days. A rising wedge of sorts may be taking shape and chartists can watch the lower trend line for the first signs of another move lower or a test of 182. Looking up, broken support marks key resistance in the 192-193 area.
**************************************************************
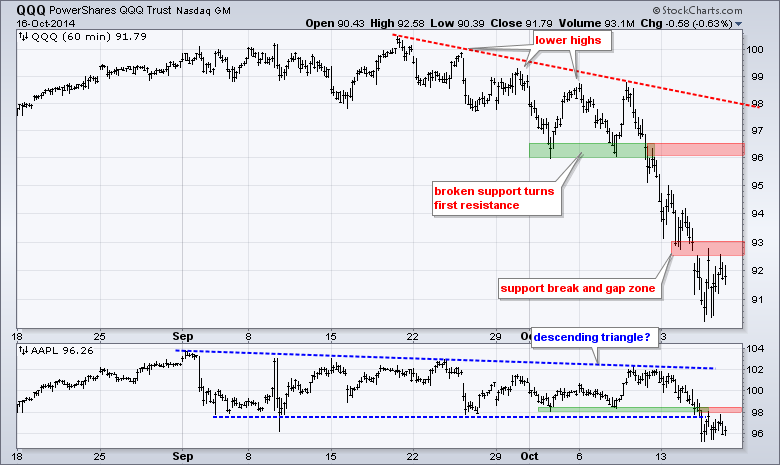
QQQ did not partake in the oversold bounce much and remains below first resistance at 93. A breakout here is needed to argue for a retracement of the Sep-Oct decline. Broken support marks next resistance in the 96-96.5 area. Apple broke support and broken support turned resistance in the 98 area. A break above 98.2 is needed to negate this break.
**************************************************************
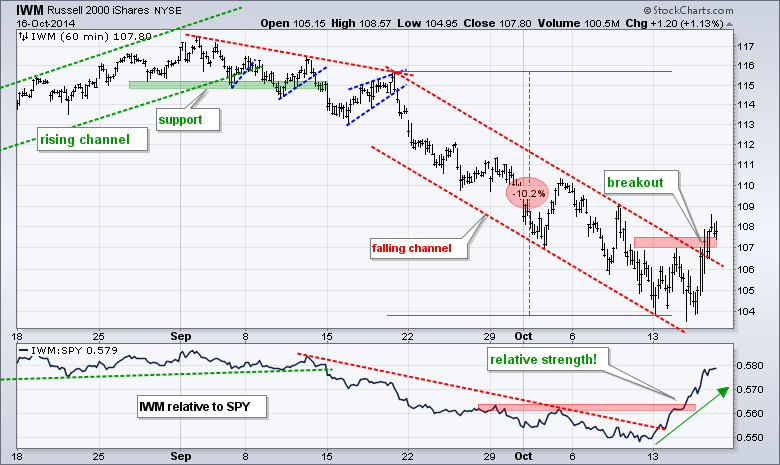
IWM is clearly the strongest of the three major index ETFs here. The ETF broke above channel resistance with a move above 107.5 and is trading at a six day high. The price relative (IWM:SPY ratio) also broke out and IWM shows relative strength. It is still quite tricky to play the long side because QQQ has not broken out and SPY is still near first resistance.
**************************************************************
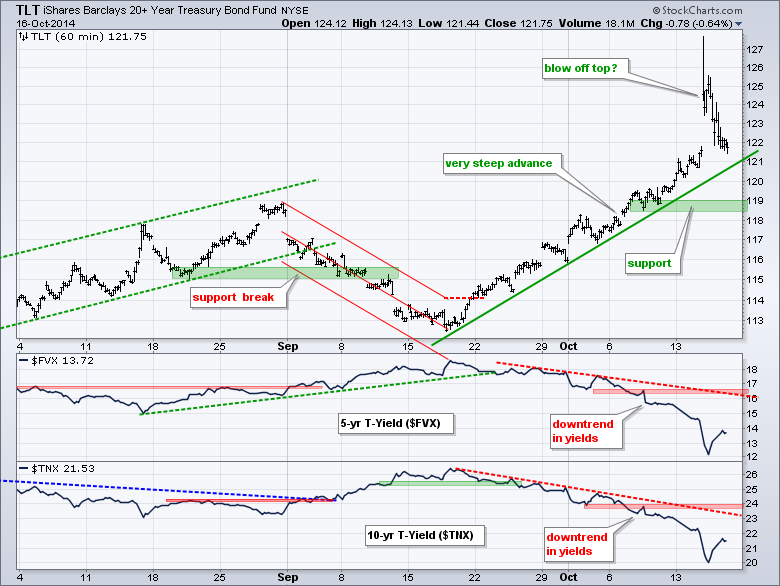
No change. The 20+ YR T-Bond ETF (TLT) gapped up and surged above 127 in the morning. This surged did not hold as the ETF closed below 123. The overall trend remains up, but this is looking like a blow off top, which is the opposite of a selling climax. Treasury yields remain in downtrends as the 10-YR Treasury Yield ($TNX) touched 2% and the 5-year Treasury Yield ($FVX) hit 1.2%.
**************************************************************
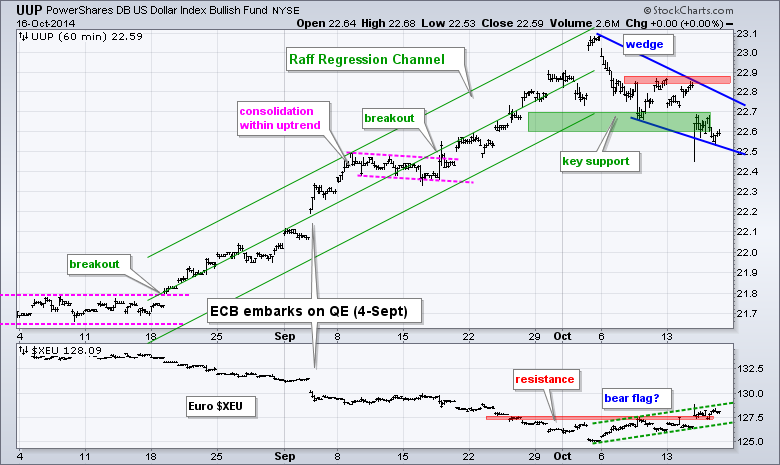
No change. The US Dollar ETF (UUP) fell back with a falling wedge as the Euro Index ($XEU) bounced with a rising flag. The falling wedge is typically a bullish continuation pattern, while the rising flag is a bearish continuation pattern. A break above 22.9 would be Dollar bullish, while a break below 126.2 would be Euro bearish.
**************************************************************
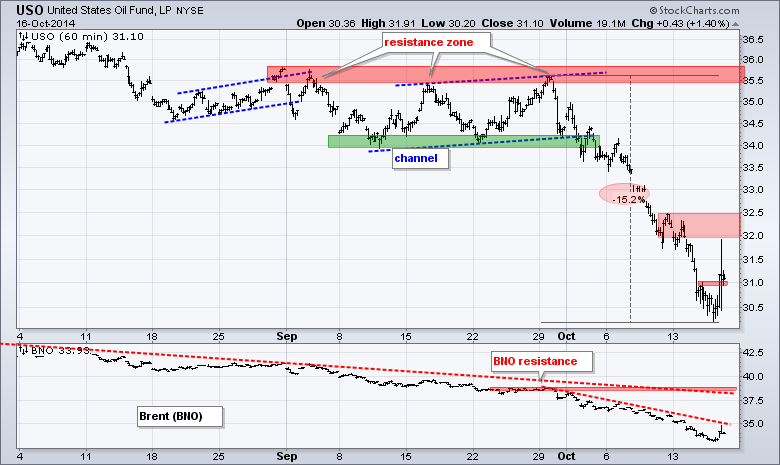
No change. The USO Oil Fund (USO) remains very oversold and in a strong downtrend. The only play here is for an oversold bounce, which is akin to catching a falling knife. A break above 31.1 could trigger this bounce and I would then expect resistance in the 32-32.5 area.
**************************************************************
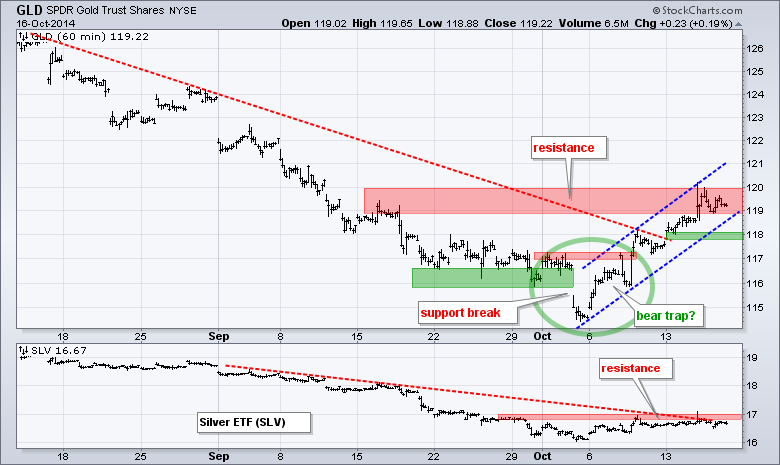
No change. The Gold SPDR (GLD) is at an interesting juncture: resistance in a long-term downtrend. Even though the ETF sprung a bear trap with the surge back above 117, the advance still looks like a counter trend move because a rising flag formed. A move below the lower trend line and support at 117.8 would reverse the rising flag and signal a continuation of the long-term downtrend.
***************************************************************
Key Reports and Events (all times Eastern):
Fri - Oct 17 - 08:30 - Housing Starts/Building Permits
Fri - Oct 17 - 09:55 - Michigan Sentiment
Chart setups are on Tuesday and Thursday.
This commentary and charts-of-interest are designed to stimulate thinking. This analysis is not a recommendation to buy, sell, hold or sell short any security (stock ETF or otherwise). We all need to think for ourselves when it comes to trading our own accounts. First, it is the only way to really learn. Second, we are the only ones responsible for our decisions. Think of these charts as food for further analysis. Before making a trade, it is important to have a plan. Plan the trade and trade the plan. Among other things, this includes setting a trigger level, a target area and a stop-loss level. It is also important to plan for three possible price movements: advance, decline or sideways. Have a plan for all three scenarios BEFORE making the trade. Consider possible holding times. And finally, look at overall market conditions and sector/industry performance.

